
Good morning Traders!
Yesterday the Bank of Mexico surprised the market when it hiked the interest rates by 0.5%. Inflation in the second biggest economy in Latin America is proving harder to tame, with a continuous rise in the past couple of months after a previous slowdown.
USDMXN
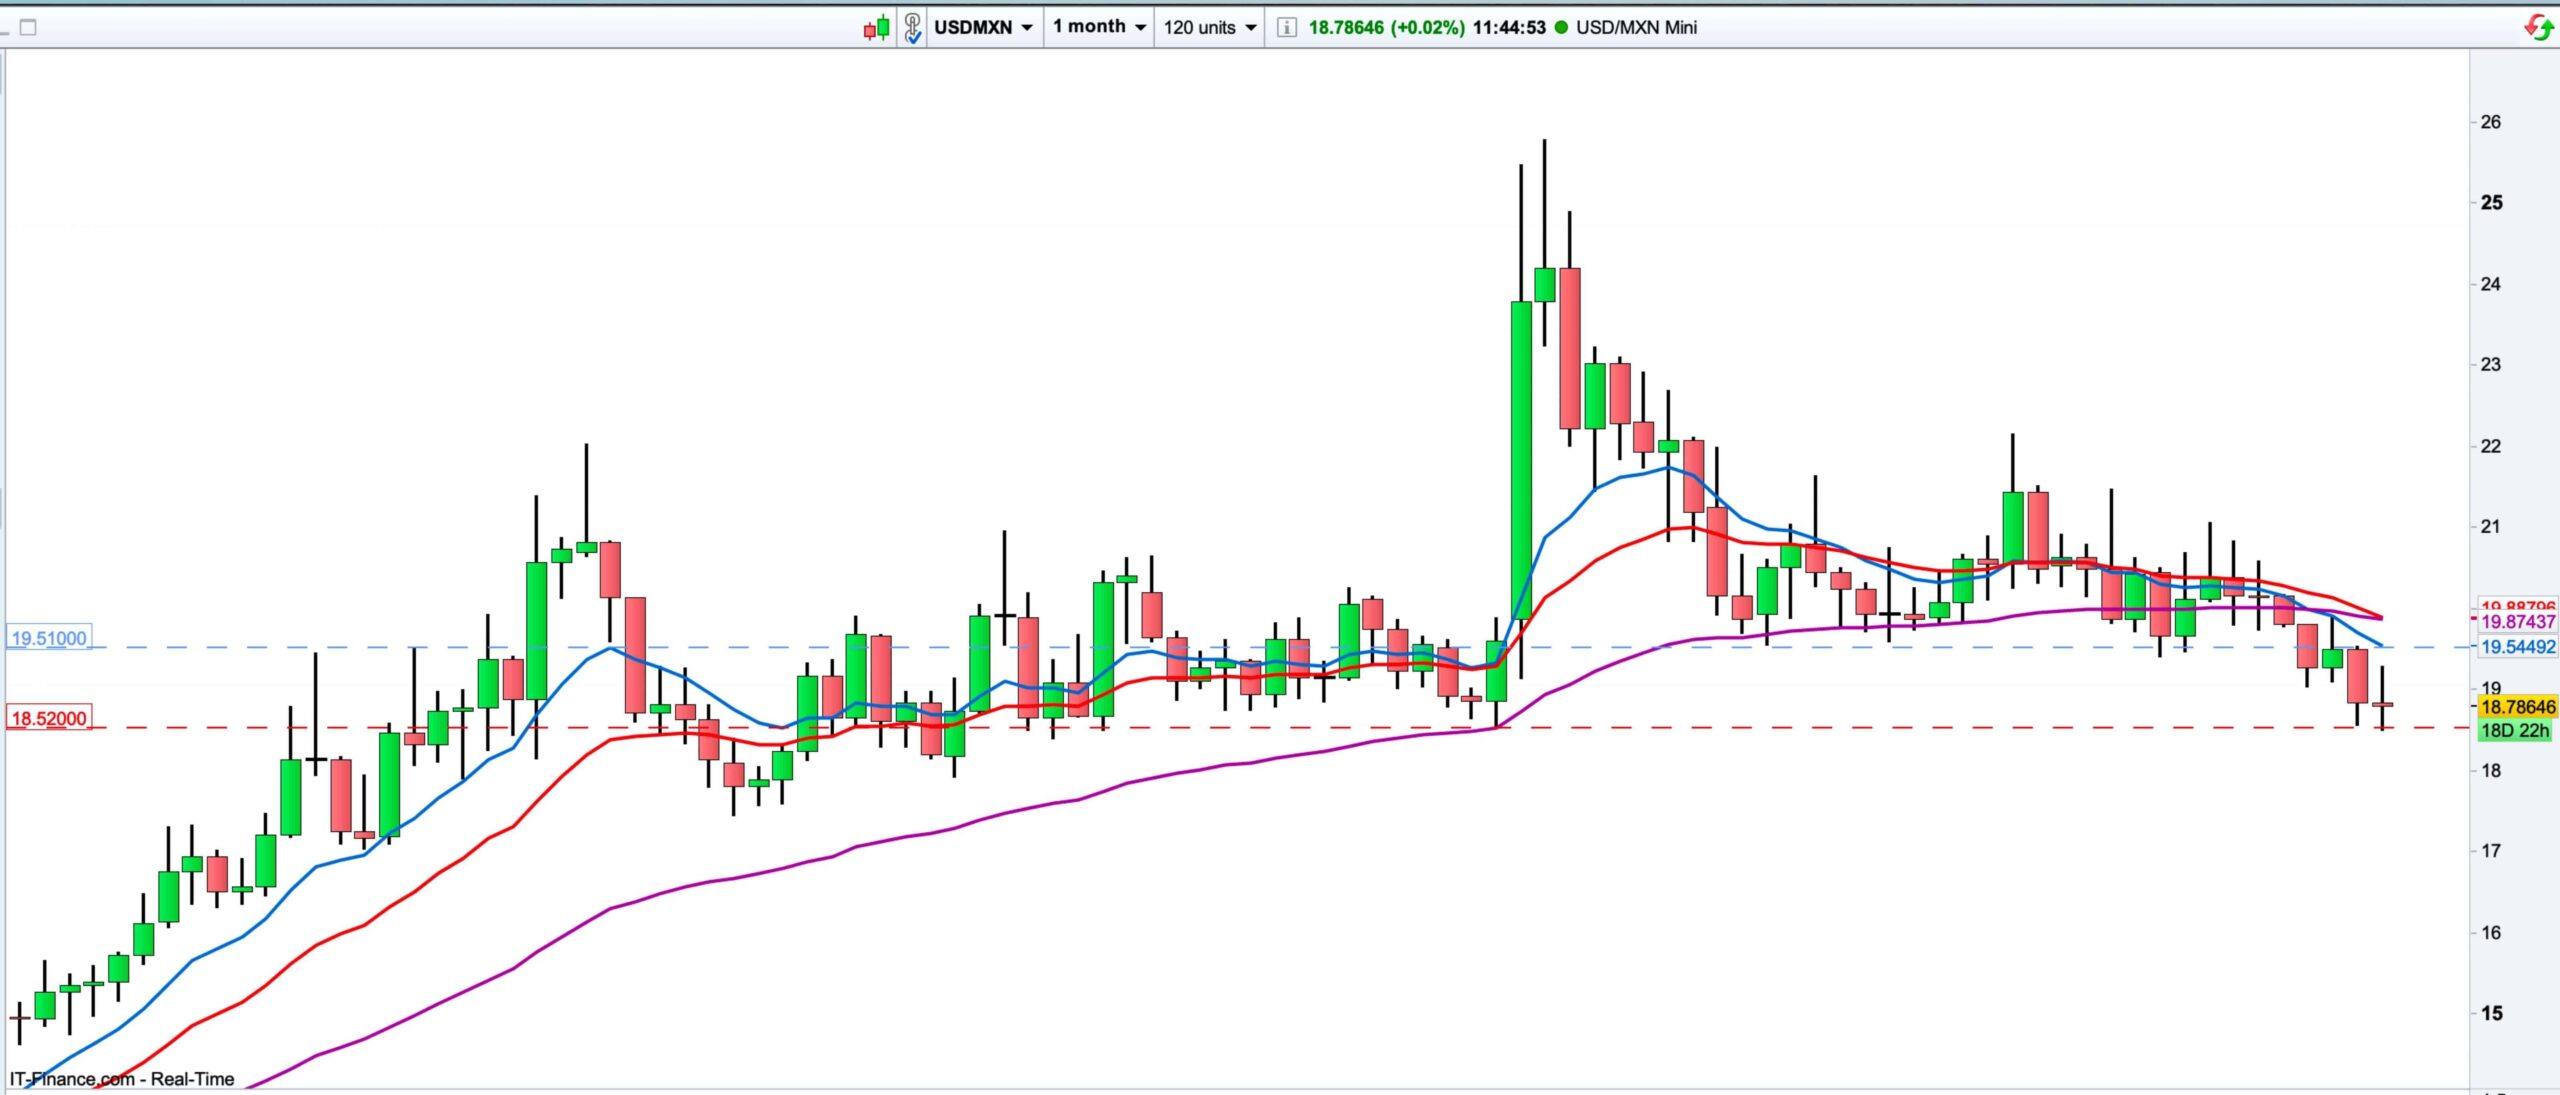
The Monthly chart has been in a steady decline since the peak it reached in Apr 2020, with the market latest move printing clear series of Lower Highs and Lower Low. After breaking through the strong Support level around the 19.50 area, the market has reacted to the next support level of 18.5 and has bounce of it several times.
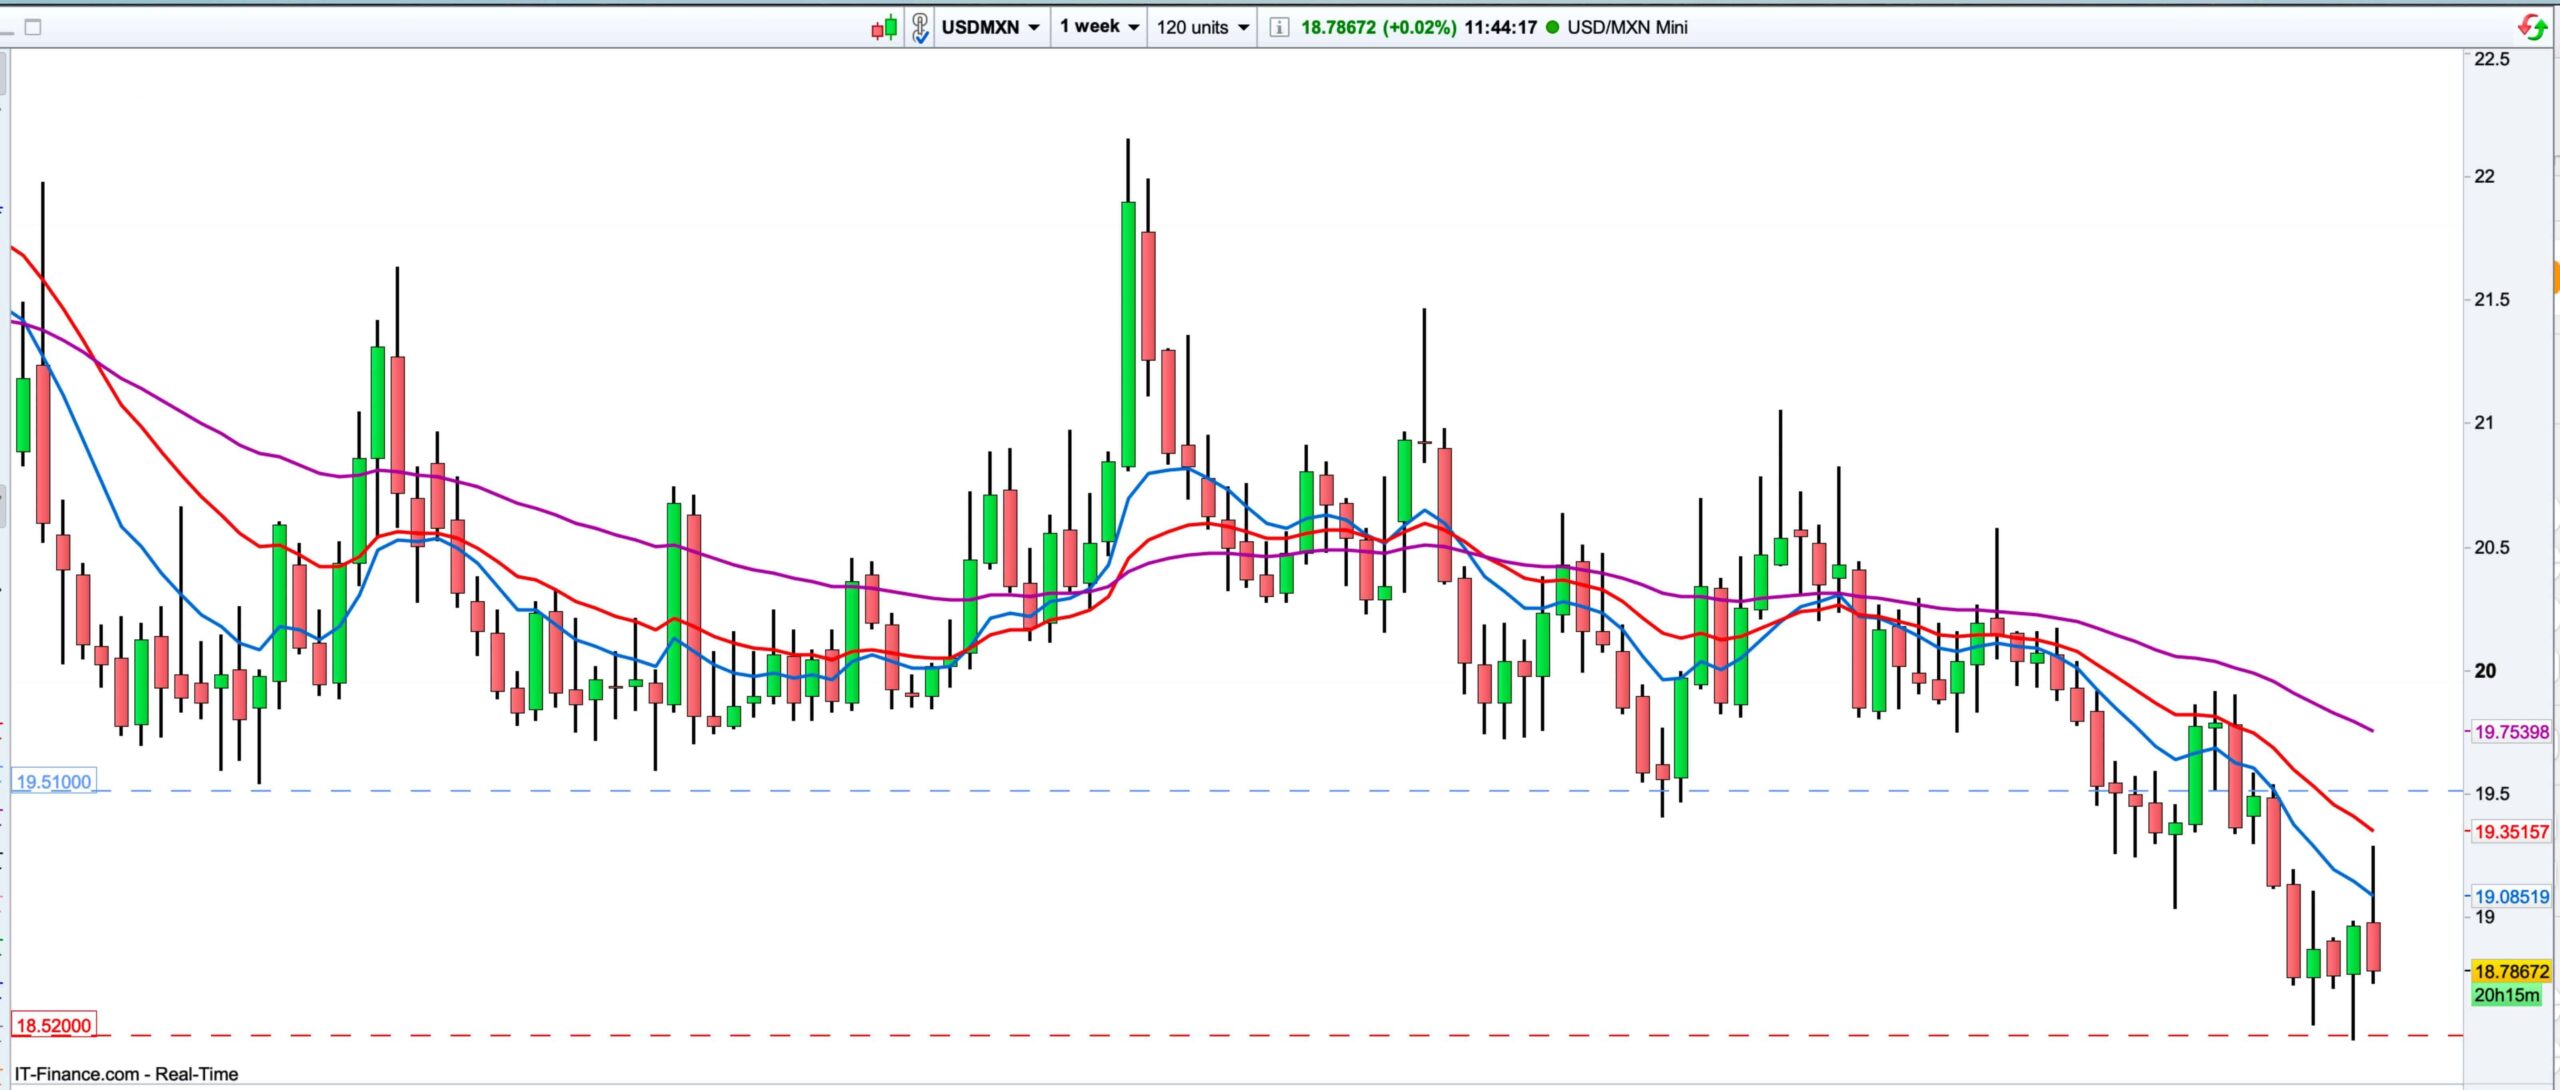
Looking at the Weekly chart, we can spot that the Weekly timeframe is also in a confirmed downtrend, and the recent activity has brought the price action closer to it’s Moving Averages.
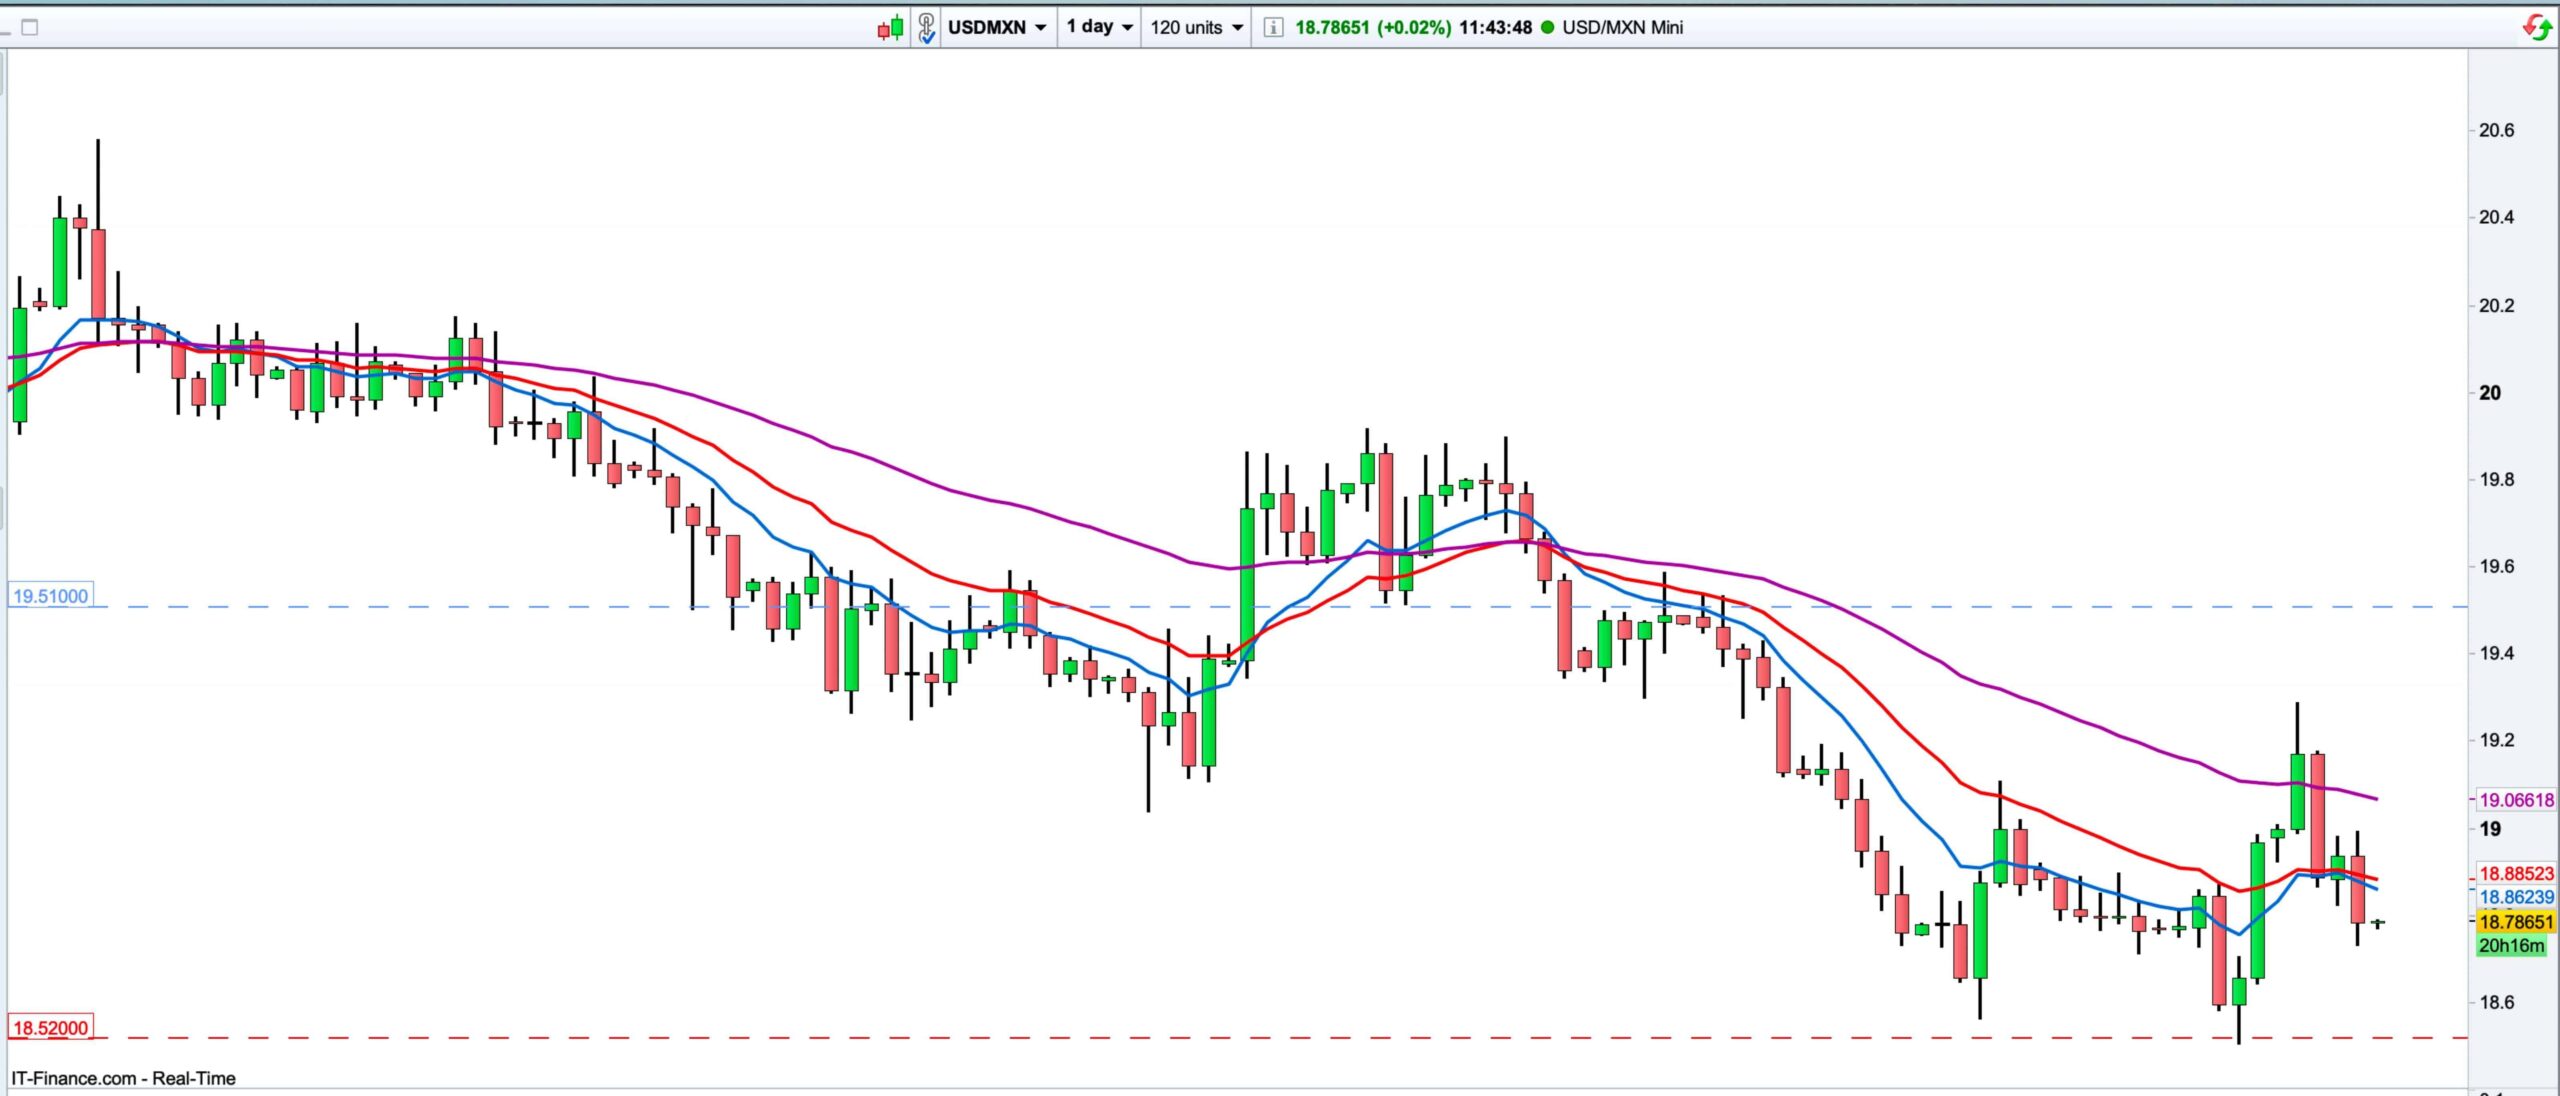
The Daily chart is no longer in a confirmed downtrend, however that is to be expected, as when a higher timeframe is pulling back, lower timeframes tend to have their trend broken or even change direction.
I’ll be looking for the market to test the 18.5 area again, and then for compression of price
pressing above this level.
Happy Trading!