Good morning Traders!
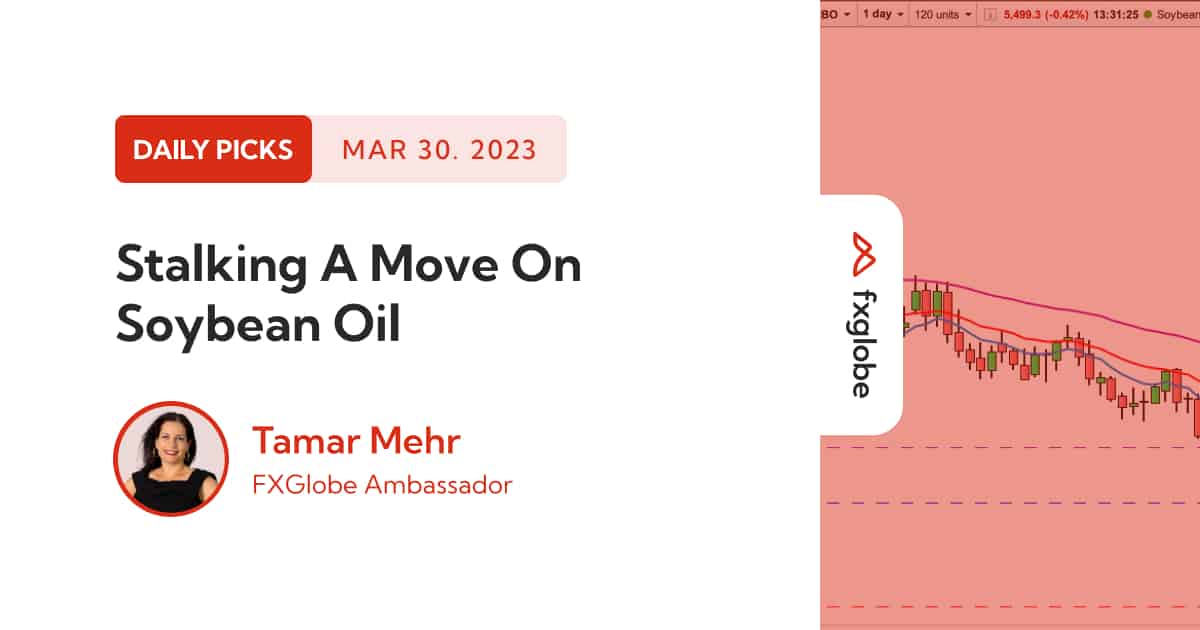
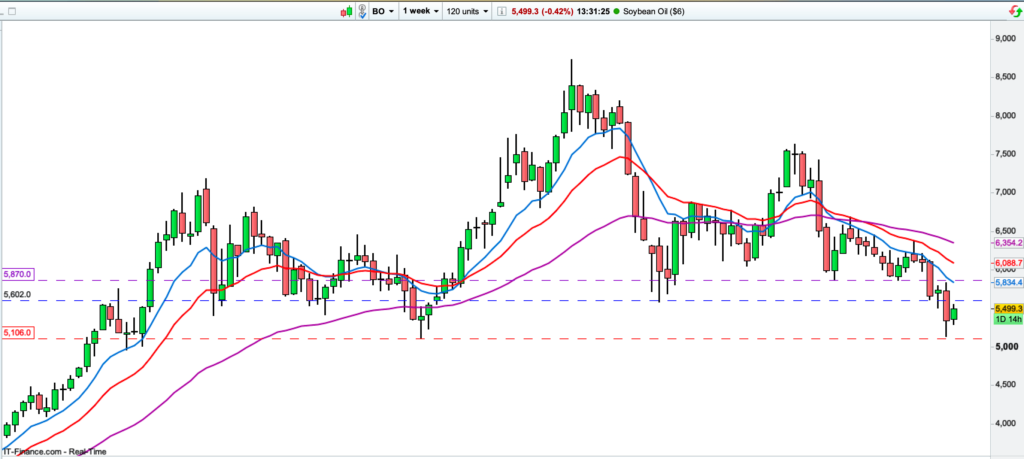
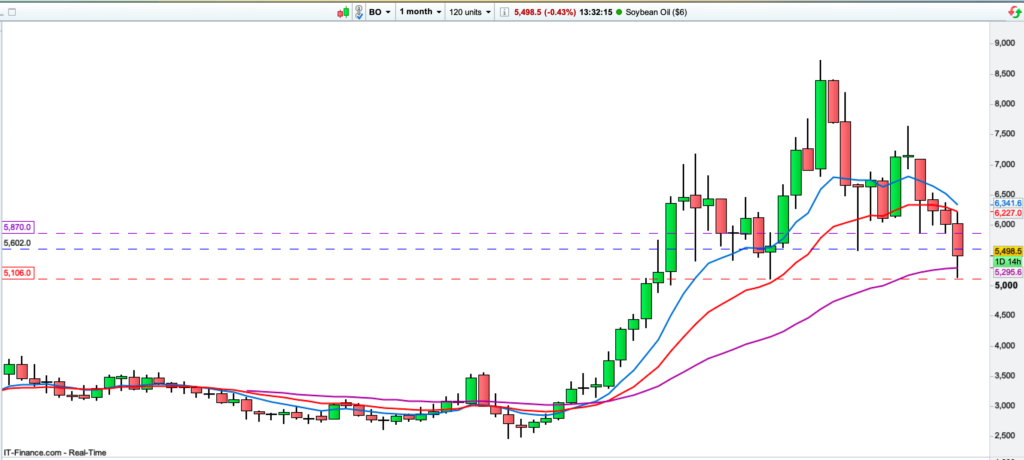
It’s rare to see a market where the trend on all the higher timeframes is in agreement. Soybean Oil is currently showing a downtrend on the Daily, Weekly and the Monthly timeframes.
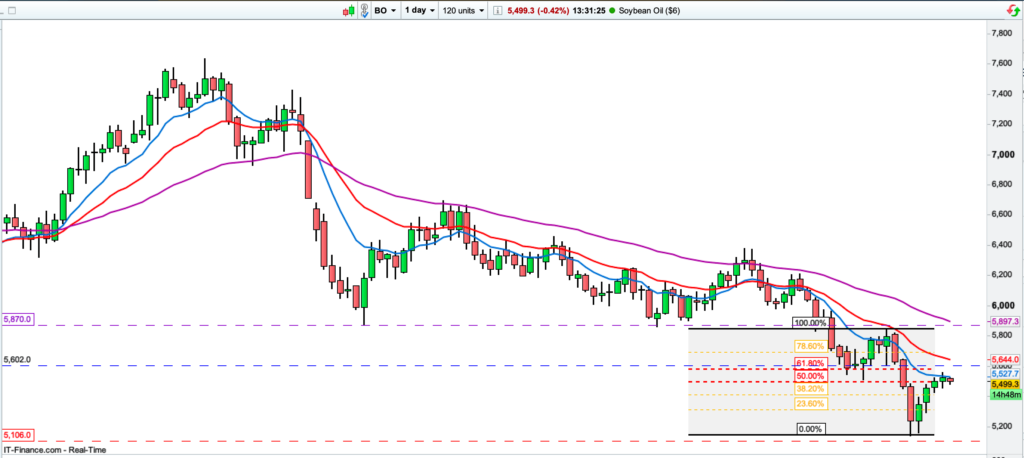
Currently the market is in the process of pulling back, after printing another Lower Low, which, once again, is a Lower Low on the Daily, Weekly and the Monthly charts.
With a careful examination of the Monthly chart, we can see that the market has come very close to the last Higher Low, but got stopped just shy of the Low. As this is an area which from there, buyers previously pushed to a Higher High, I’d expect some buying momentum to return to the market.
For short timeframe setups I’ll be looking for a reaction to the 56 area, which has the 61.8% Fibonacci retracement clustering with an S/R level on the Daily chart latest move. And for a longer term setups, I’ll be looking for a deeper pullback, in the context of the Weekly chart, into the level of 58.70 which was the breakout level on the way down, and may offer resistance for the pullback.
Happy Trading!