
Good morning Traders!
Much have been said about the rising costs of an American breakfast, with each component and it’s fundamental reasoning. In this article, I’d like to take a look at the chart of NY Orange Juice and the technical ingredients across several timeframes.
NY Orange Juice
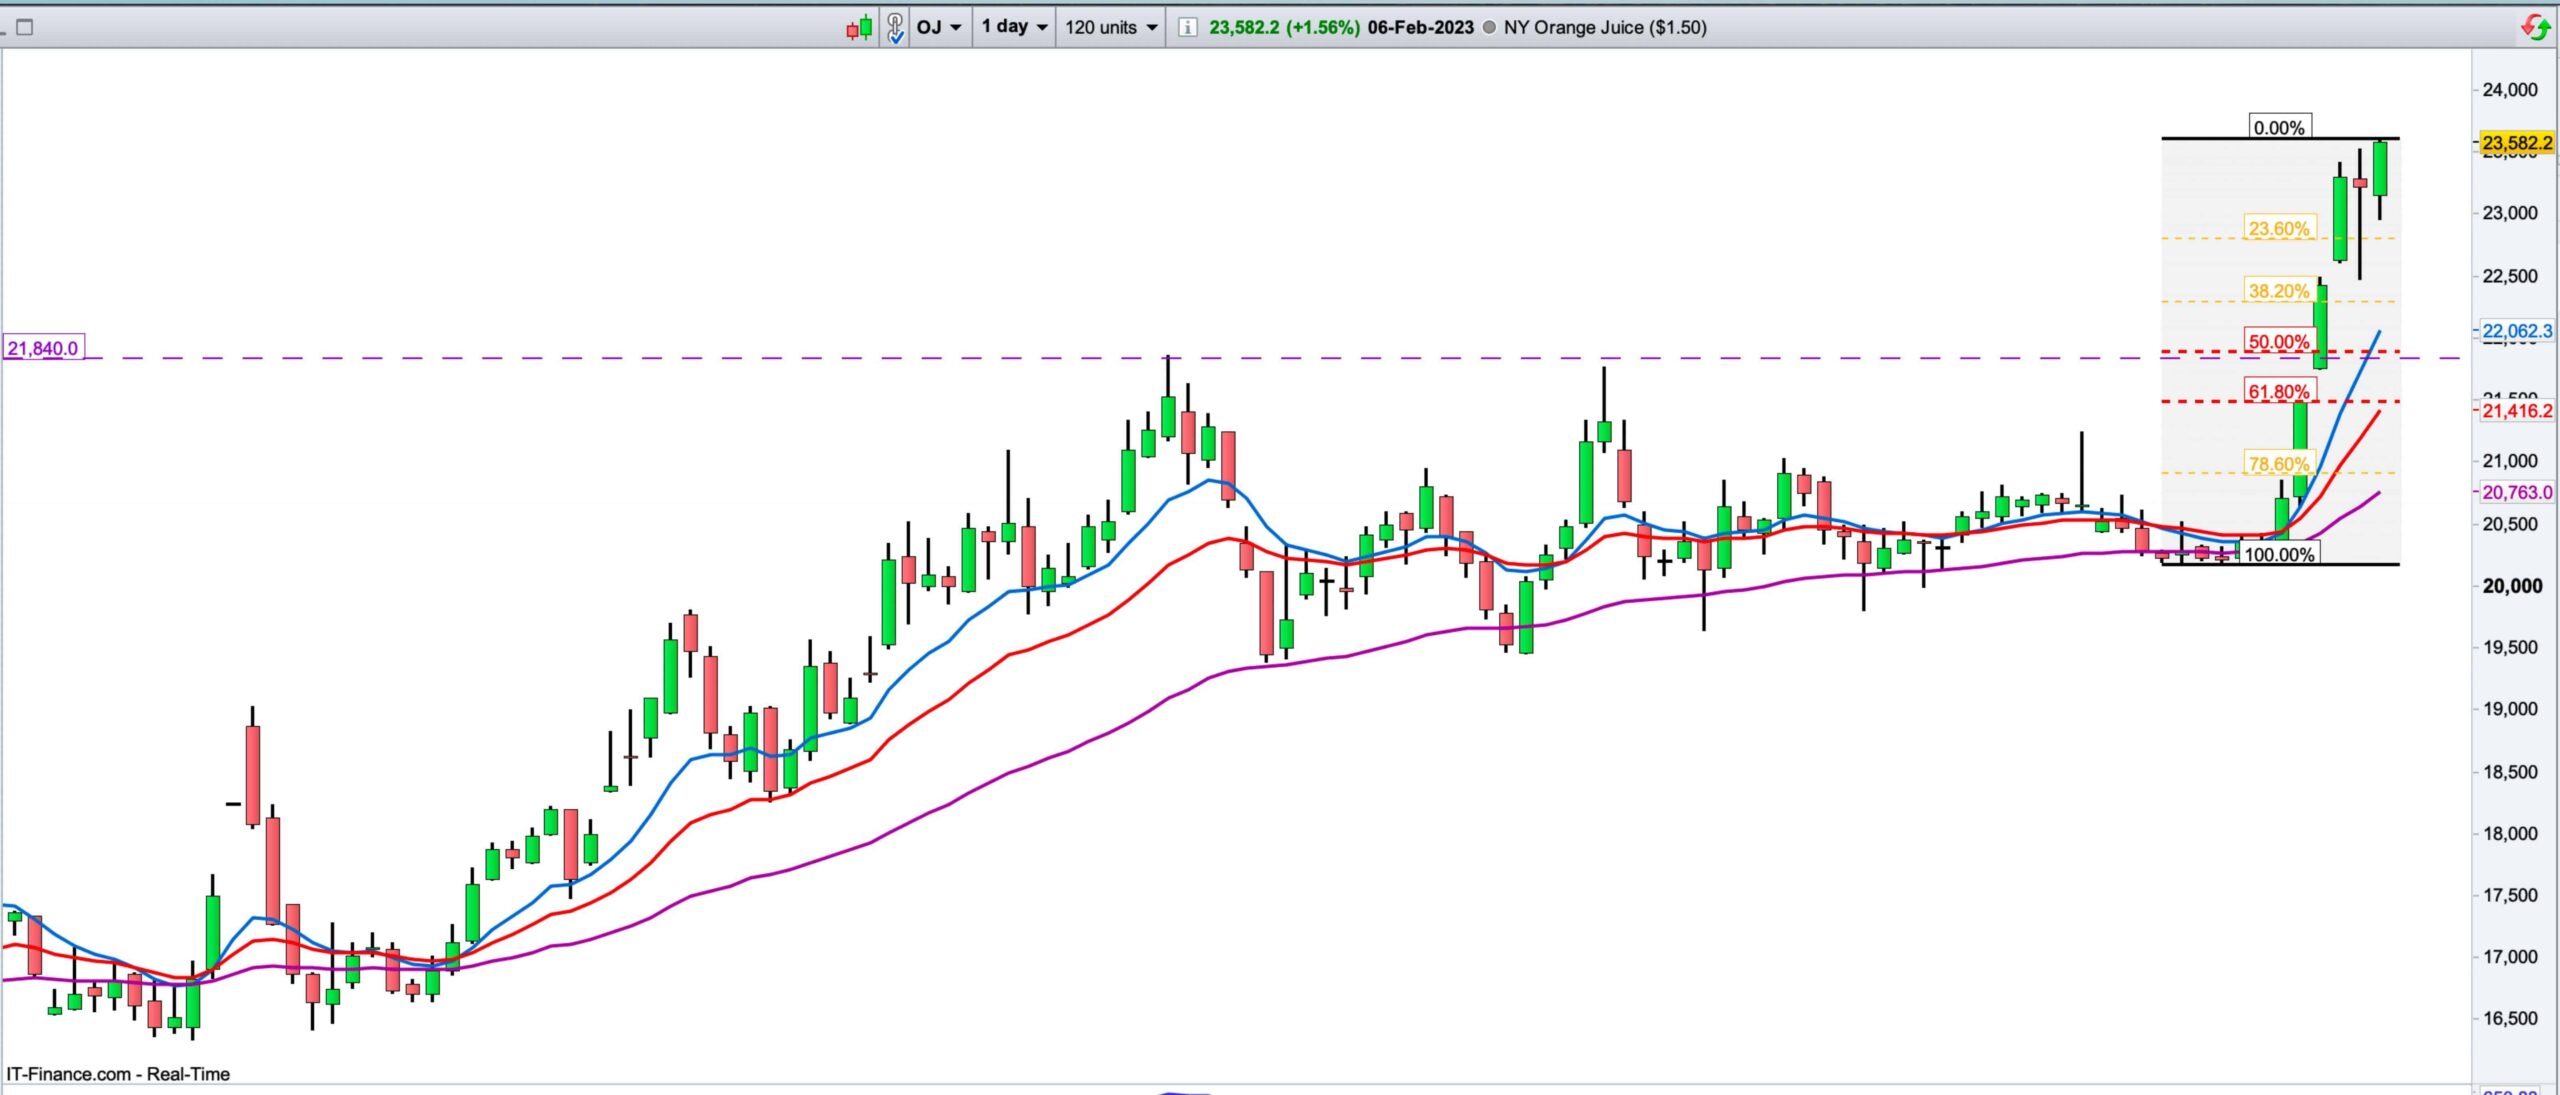
Last week the price of NY Orange Juice broke to new highs, and yesterday price has already broken the highs of last week very strong and bullish candle.
On the Daily chart, price has moved higher with strong bullish momentum, decisively breaking, and closing, above the last place the sellers were able to push the price to a Lower Low, around the level of 21.84.
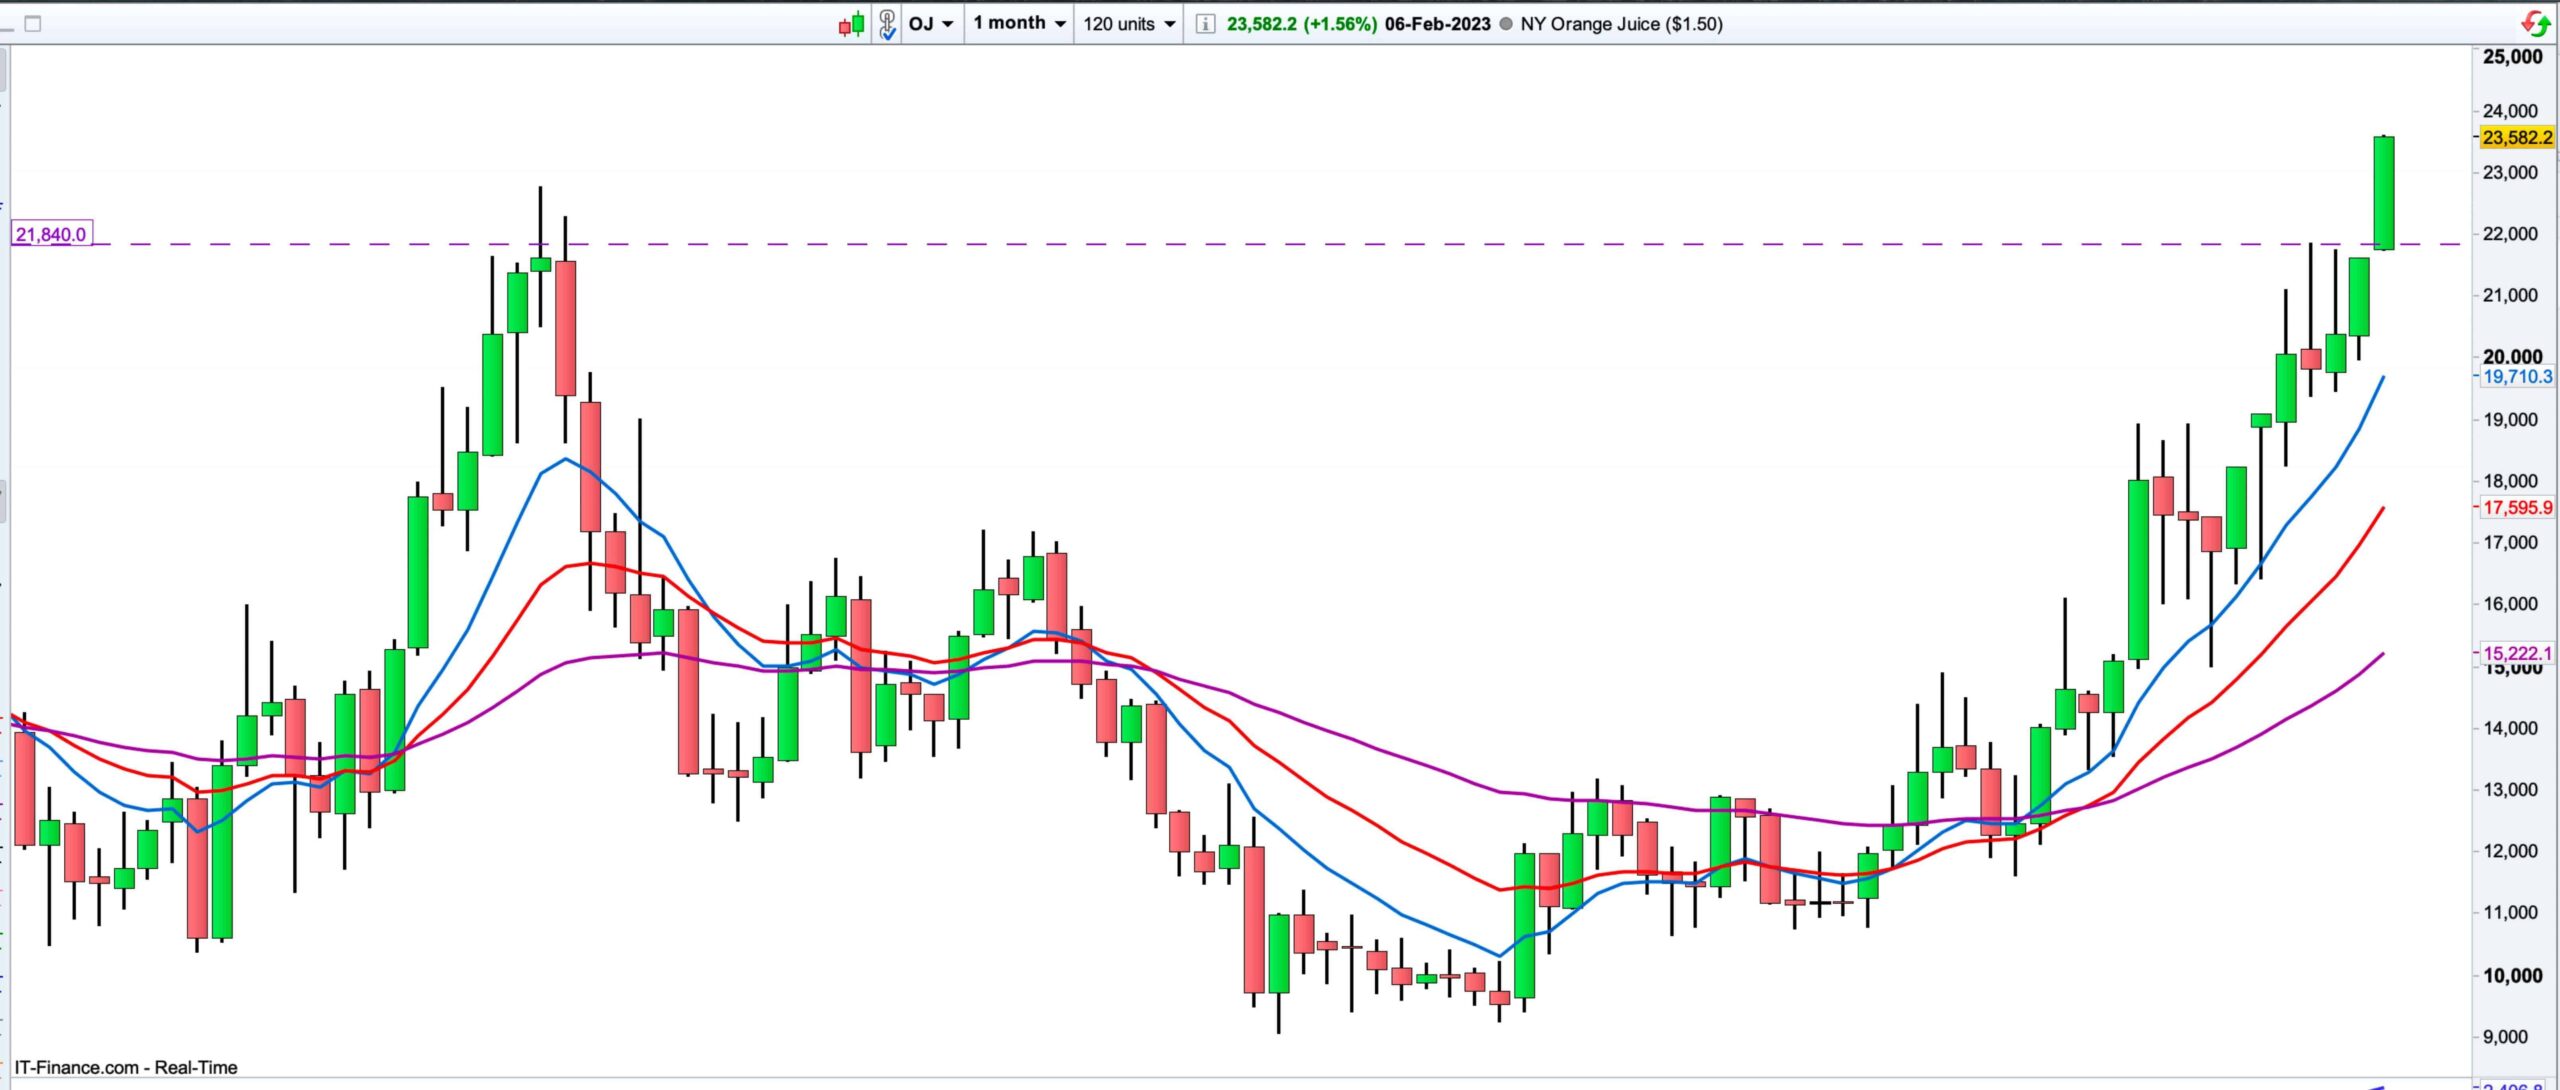
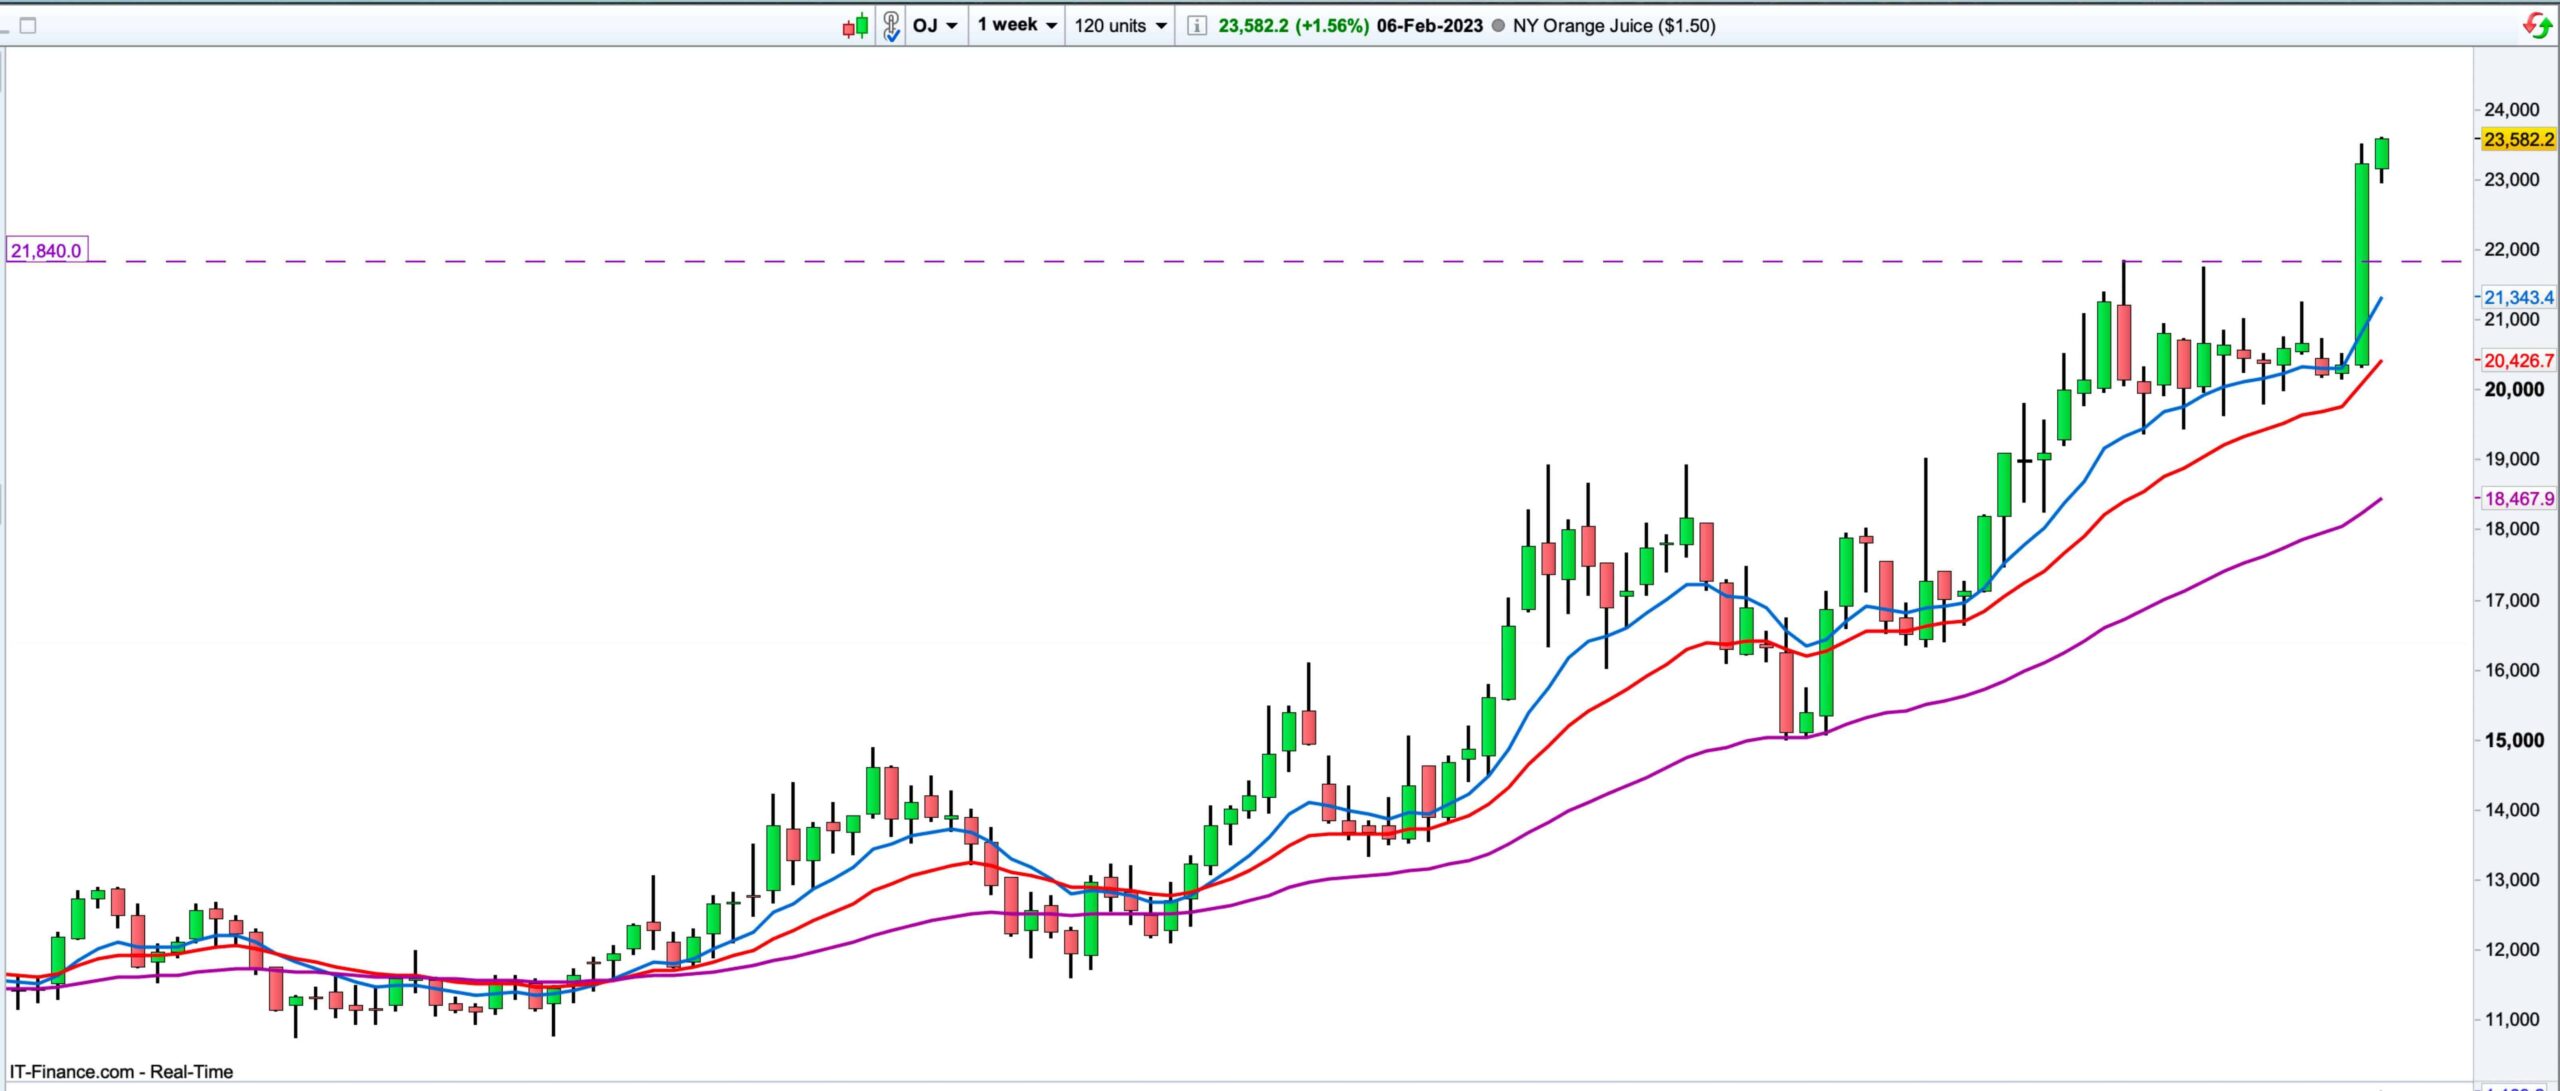
The Weekly chart is also in an uptrend, and after a consolidation and a sideways movement around the 2.00 area, we can see the strong break of last week candle, clearing all the highs in this consolidation area. The Monthly chart is also in an uptrend, and the latest bullish push cleared two Monthly bearish rejection candles on the way up.
Price is currently overextended from it’s moving averages on the Daily, Weekly, and the Monthly timeframes. Drawing the Fibonacci retracement of the latest daily move, has the level of 21.84 clustering nicely with the 50% Fibonacci retracement. I’ll be waiting for a pullback and a release of this strong bullish pressure, and then for signs that the pullback is over, and the buyers are ready to take over once more.
Happy Trading!