Welcome Traders!
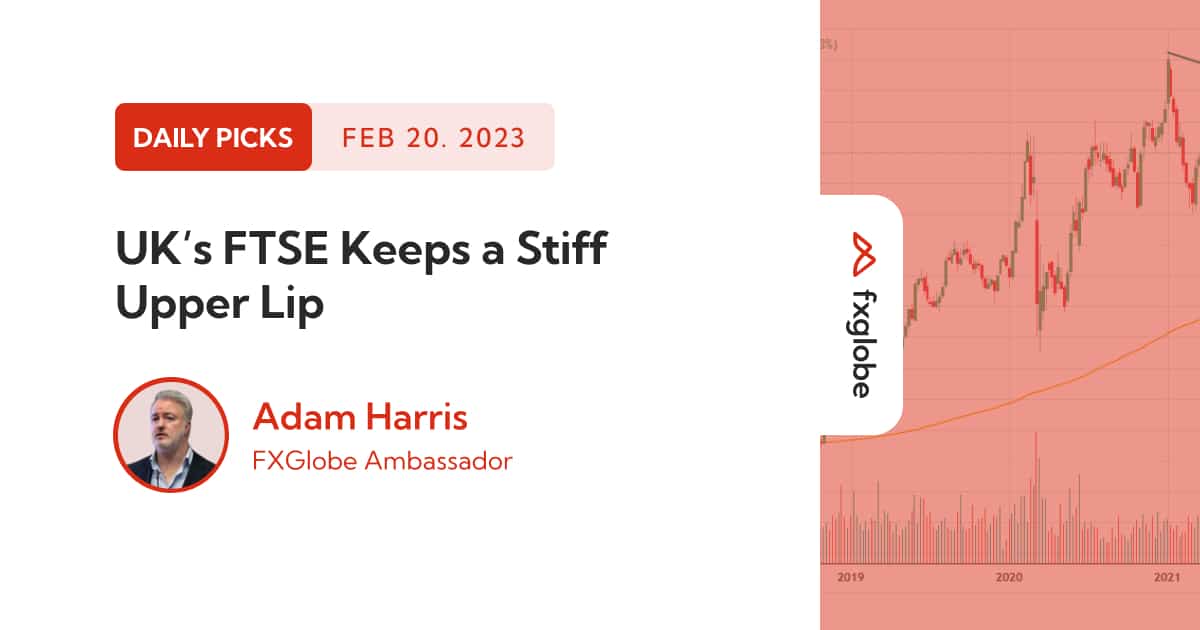
Colour me surprised that our FTSE 100 index, which has, during my tenure as a trader, almost always lagged behind the U.S. Indices (S&P 500, Dow Jones, NASDAQ and Russell2000), and not always exhibited much of a bullish mature.
The 6,700 level has acted as resistance for 16 years from its first touch in December 1999, until December 2016, after which 7,600 became the new range. This is not nearly as much growth as the U.S. and many other indices around the world has shown during that same period.
What’s impressive is that as soon as 2023 kicked off, the FTSE burst out of the gate with new all time highs, and has followed through with this in February.
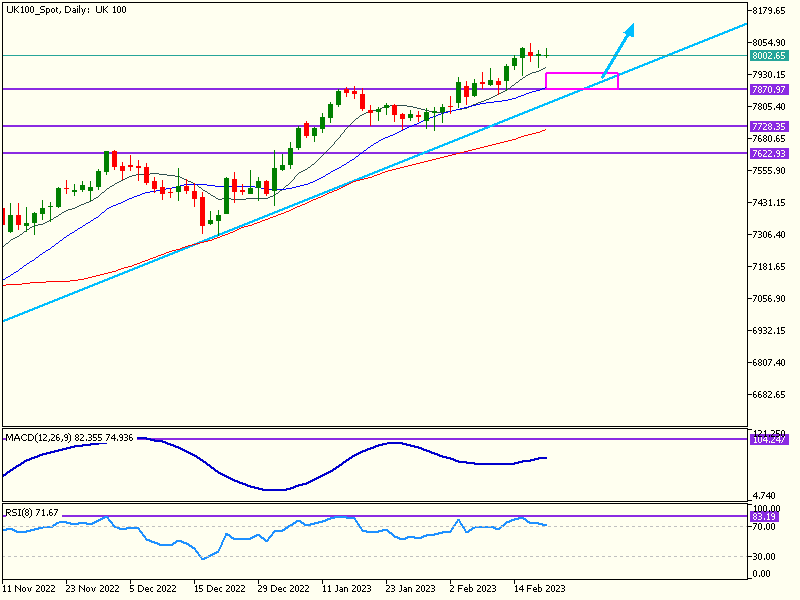
The daily chart now displays a very healthy, smooth trend to the upside.
The natural ebb-and-flow of the markets could see it retrace down to the upwards trendline and price level area around the most recent highs.
If the trend is to continue, then it would make sense if this area produced bullish candles, which could then form the basis for the next leg up.
This could result in this index reaching around 8,155 which is truly encouraging, given so much of the recent disparaging data and fears of a looming recession in the U.K.
Happy Trading!