

Good morning Traders!
These 3 charts could help traders plan their next moves around Gold.
Let’s start with the Monthly for context:
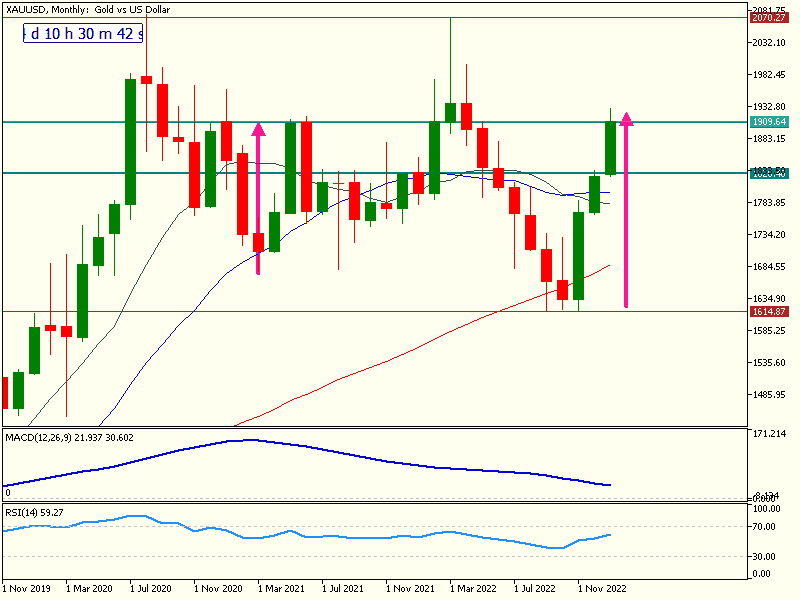
Gold’s recent moves almost straight up from $1,600 are the most aggressive since a similar attempt was made in March 2021 (seen to the left). Also, it has travelled a lot further.
It now sits at a major price level which could be the most resistance it has faced in a while.
Now let’s take a look at the Weekly chart.
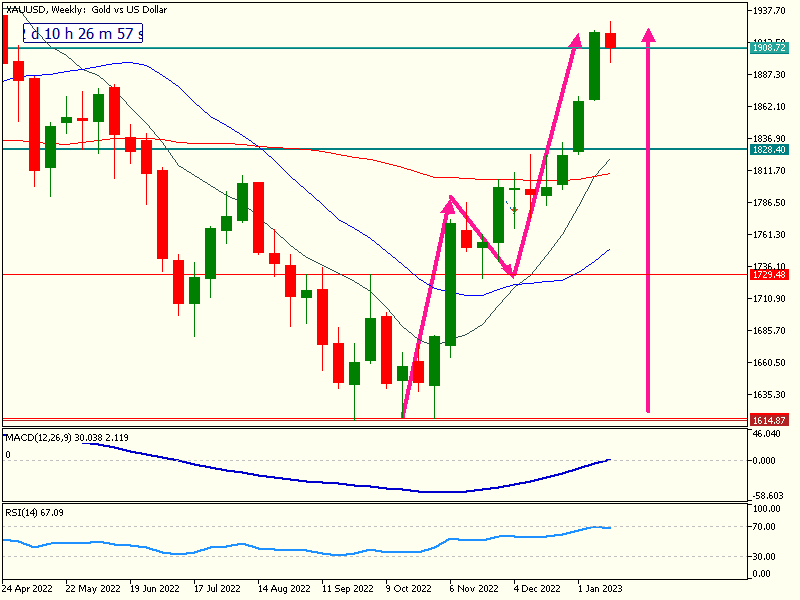
Here we can see that it is also over-extended by some way on this timeframe.
It’s only Thursday, but there is also a small red weekly candle printing at a major resistance level.
In many cases this would lead to the beginning of a swing high forming, should price break below this red candle in the following week, potentially seeing Gold drop to a lower level.
The big question is, which level?
There are several levels that qualify as valid price targets, but ultimately it will depend on how bullish Gold is leading into the future, which no-one can predict.
In the weekly chart, a retracement in this weekly uptrend down to $1,800 makes the most sense: It’s a major level, and a 61.8% retracement from the highs.
Let’s look at the daily chart for more detail.
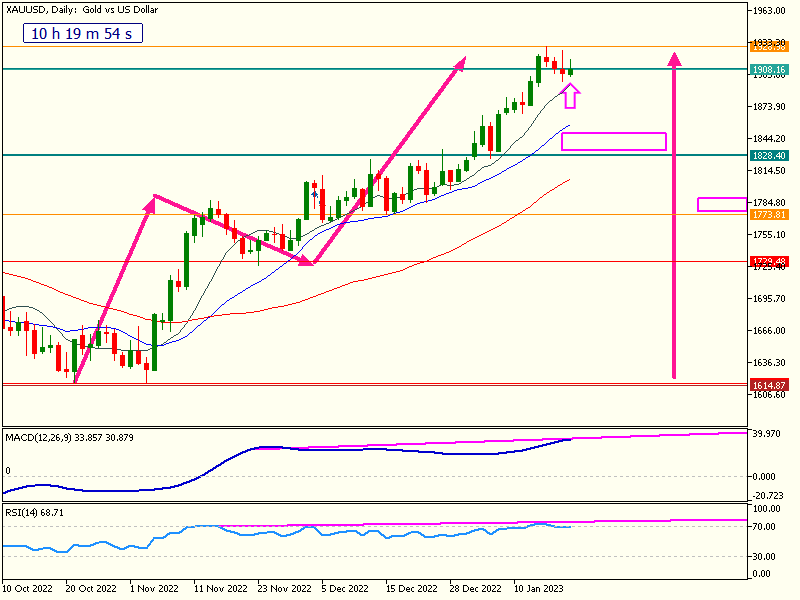
It gets tricky here; there is NO divergence yet on either of the momentum indicators below, hinting that although it is over-extended and at a major level, it is not ready to stop. There’s even a green/bullish candle printing today.
Often in situations like this there is another attempt to move higher, which then leads to a stronger rejection and a subsequent sell-off.
Two areas of interest that price could ultimately retrace down to here are the highlighted boxes, but we will need to see how price action reacts when it gets there.
Thankfully, once Gold has had a healthy pullback, it could then provide fresh buying opportunities.
Happy Trading!