
Hi traders!
Today, we’re delving into the fascinating topic of detecting over-extended markets from a technical perspective.
As traders, it’s crucial to recognize when an asset’s price has stretched too far, too fast, and might be due for a correction or consolidation.
One essential aspect of this process is examining whether the price is at a major support or resistance level.
Additionally, keeping an eye on our momentum indicators, such as the MACD, for divergence can provide valuable insights.
In this article, we’ll show several daily charts that could suggest the current trends haven’t corrected enough, helping you make more informed trading decisions and potentially capitalize on valuable opportunities.
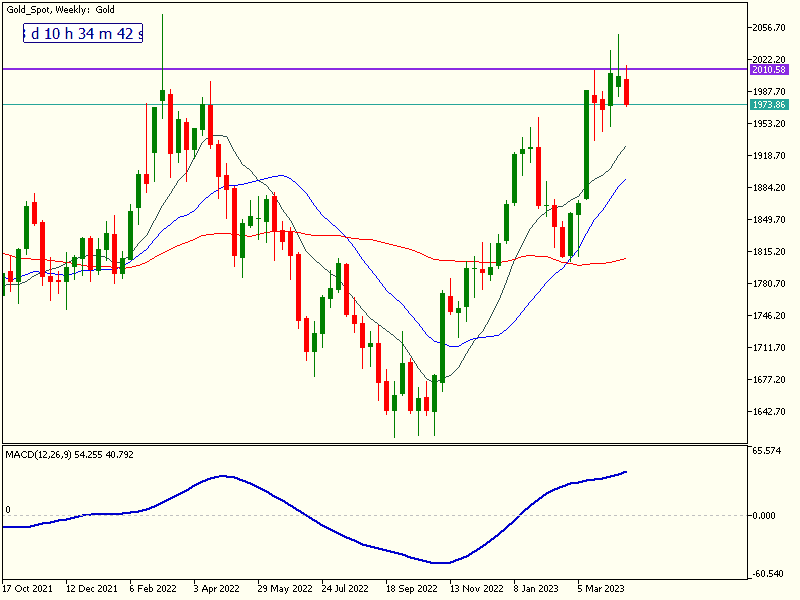

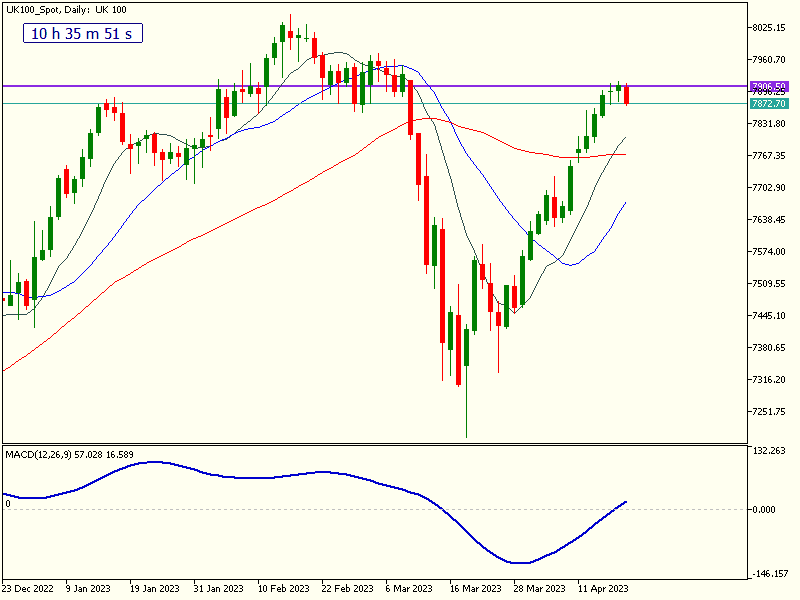
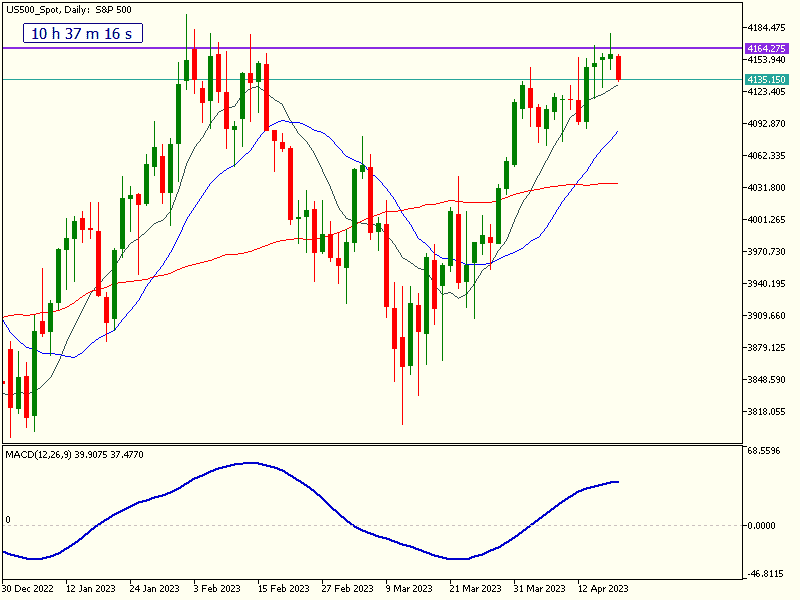
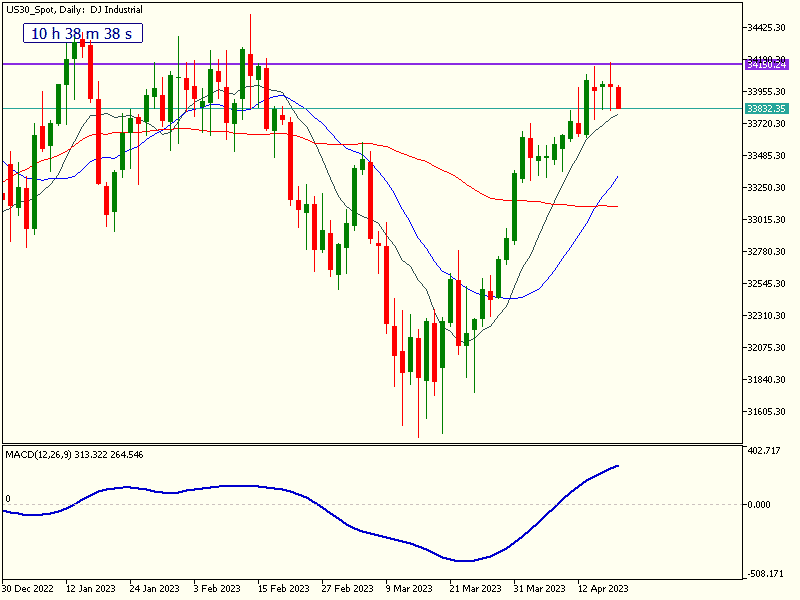
For the US30, US500, UK100, DE40 and Gold, all of them have had good runs to varying degrees over the last few weeks. They’re all near major highs, and price action has started to stagnate and ‘spike’ at the top.
It ‘seems’ like a move lower is becoming more likely, however, it’s probably more likely to be a medium-term correction, than a longer term one. I’ll be following closely and update you when either path becomes more clear.
Happy Trading!