
The first Friday each month presents one of the biggest opportunities on the forex calendar – the release of the US nonfarm payrolls (NFP) report.
As the most closely watched gauge of employment and economic health, nonfarm payrolls can spark explosive moves in currency pairs lasting well beyond the release minute.
For skilled forex traders, mastering NFP trading strategies represents a major edge. Time entries right as the print hits, and you stand to gain from substantial volatility and liquidity. But miss your window or mismanage risk, and you may face brutal slippage from whipsaws. New traders should paper trade NFPs until consistent in executing plans.
This extensive guide explores all facets of trading nonfarm payrolls successfully and consistently, including:
- Calculating NFP figures and importance as an economic indicator.
- Release timing and accessing projections plus actual data.
- Interpreting forecasts versus actual job growth intelligently.
- Leveraging various chart patterns and trends around announcements.
- Executing tactical trade entry and exit strategies around the release.
- Implementing prudent risk management and psychology.
- Case studies and lessons from historical NFP events.
- Key takeaways for trading NFPs profitably each month.
Let’s get started breaking down this high-impact news event, top trading strategies, and how to generate consistent performance from volatile NFP prints.
What are Nonfarm Payrolls and Why do they Matters?
On the first Friday each month at 8:30 AM Eastern, the Bureau of Labor Statistics (BLS) releases its monthly employment report including the headline nonfarm payrolls figure. So, what exactly does this widely watched metric mean?
Defining Nonfarm Payrolls (NFP)
Nonfarm payrolls measure the net change in employed workers during the previous month across all US business sectors excluding farm employees, private household employees, nonprofits, proprietors, serve in the military, the unincorporated self-employed and certain government agencies.
NFP provides a comprehensive look at job growth across over 80% of American employment. Gains signal economic expansion while declines may reflect softening conditions.
Why NFP Moves Markets
By influencing outlooks on the broader US economy, business cycle and monetary policy, NFP significantly impacts forex and other markets.
- Positive NFP lifts dollar valuation based on a strong US economic outlook.
- High job growth raises expectations of Fed rate hikes which supports the dollar.
- Downside NFP surprises weaken the dollar as easy Fed policy is anticipated.
- Major deviations between forecasts and actuals fuel heavy volatility and liquidity.
Clearly, seasoned traders watch NFP carefully each month for invaluable signals about upcoming USD and general market dynamics. Gaining an edge around releases can pay major dividends.
Now that we’ve covered the importance of NFP data, let’s examine how the widely followed statistic gets calculated.
How the NFP Statistic Gets Calculated Each Month
A multi-step process involving extensive surveys underpins the final NFP number each month. Here is how the BLS compiles the report:
Step 1: Review Payroll Records from Businesses
The process starts by reviewing employment records submitted throughout the month by over 400,000 US companies. Figures are categorized by industry sector, firm size, location, and other attributes.
Step 2: Conduct Household Employment Survey
This survey covers 60,000 households, questioning household members on their employment status throughout the prior month. Questions determine whether individuals worked, looked for work, were unemployed, etc. These household responses supplement business payroll records.
Step 3: Develop Estimates of Total Nonfarm Employment
By combining business payrolls with household survey results, BLS economists generate estimates of total US nonfarm employment levels for the reporting month. Adjustments are made to account for new business formations or closures.
Step 4: Calculate Monthly Change in Payrolls
Finally, the headline monthly NFP growth figure is calculated by comparing the current month’s employment level to the prior month. The net change represents total US job gains or losses, excluding specified categories like farms.
This rigorous methodology ensures an accurate snapshot of job creation across the extensive US labor market. With so much riding on the number, the BLS goes to great lengths ensure NFP credibility and precision month to month.
Now that we’ve reviewed what goes into NFP, let’s shift to release logistics and interpreting the data from a trading perspective.
Interpreting NFP Reports and Forecasts Intelligently
To trade NFP announcements profitably, you must analyze the actual print intelligently in the context of projections and prior months’ reports. Follow this process:
Compile Consensus Forecast of Economists
In the week ahead of NFP, economists publish their projections for the next print. Track leading forecasts from banks and analysts to gauge expectations. Compile a consensus estimate based on average projections.
Review Previous Month’s NFP and Subsequent Revisions
Put the upcoming print in context by reviewing the previous month’s NFP figure. Were the past 1-2 months especially strong or weak? Also check for any revisions to prior prints.
Analyze Actual Print vs. Forecasts Immediately
Once the actual current NFP figure crosses at 8:30 AM, instantly compare it to economist forecasts. If actual job growth exceeds expectations, dollar strength typically results. If NFP disappoints relative to projections, USD weakens.
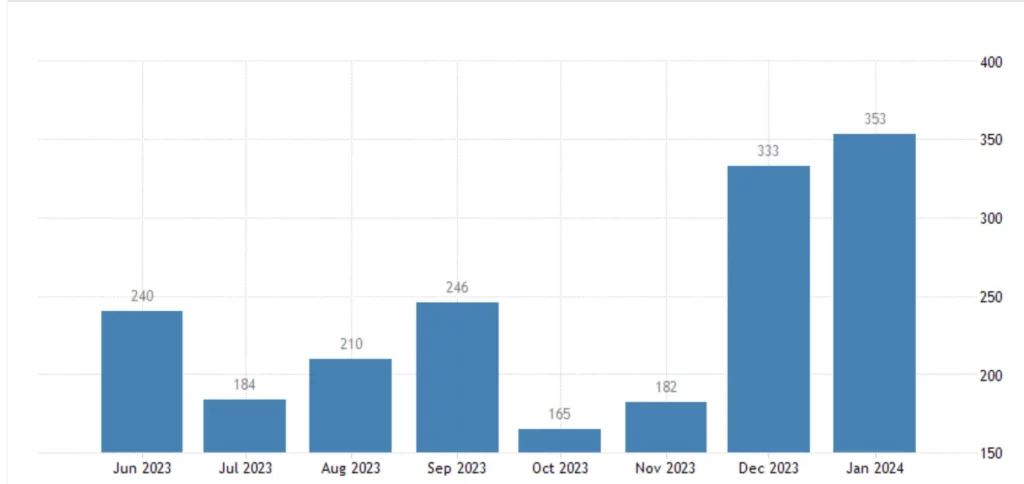
Benchmark Against Historical Averages and Trends
Keep longer term averages in mind when evaluating prints. Monthly gains above 200,000 indicate solid expansion while drops below 100,000 are concerning. But focus on momentum rather than just absolute numbers.
Consider Other Employment Metrics Too
Beyond headline NFP, also analyze the unemployment rate, labor force participation, hourly wages, and underemployment to build a complete picture. But NFP drives most volatility.
Update Your Bias Accordingly in Real-Time
Assess how actual NFP aligns with your projections, and update bias accordingly. If prints align with your outlook, proceed accordingly. But if NFP flips expectations, nimbly adjust.
Accurately deciphering NFP reports relative to estimates and historical data provides the context needed to trade releases prudently. Now let’s turn to executable trading strategies.
Tactical Trading Strategies to Capitalize on NFP Volatility
Attention here:
Before detailing trading strategies, we must state that the following content is for educational purposes only and does not constitute financial or trading advice. CFDs carry significant risk and traders must conduct their own research and fully understand the risks prior to trading.
👉 No trading approach is without potential risk of capital loss, and past performance does not guarantee future results. Always practice prudent risk management when trading, and never risk more than you can comfortably afford to lose.
The author and publisher accept no liability for any trading actions taken based on the strategies discussed.
Now, with the proper risk disclaimer stated, here are some tactical trading strategies traders may look to utilize around the release of NFP data:
Commonly Used Breakout Strategy Using OCO Bracket Orders
This commonly utilized strategy aims to capture volatility from whichever direction price breaks out:
- You might start with placing a buy-stop and sell-stop order 10-20 pips above and below market price before the release.
- Attach take profit and stop loss orders to each pending order, forming an OCO bracket.
- Upon NFP release, one order will trigger depending on the breakout direction. The other OCO order automatically cancels.
- Target quick profits as momentum peaks then reverses. Define risk upfront with stops.
- Adjust strategy based on pre-release bias – for example, favoring upside breakouts if strong NFP expected.
Executed well, OCO breakout strategies allow reacting swiftly to sudden price movements in either direction following a print.
Pre-Release Directional Bias Strategies
Alternatively, traders may speculatively take directional positions aligned with NFP expectations:
- If forecasts suggest upside surprises, go long USD in anticipation of positive NFP data.
- If economists expect downside NFP surprises, go short USD positioning for disappointment.
- Scale position size based on degree of conviction in alignment with projections.
- Quickly take profits on moves in your favor following 8:30 AM. Close positions within 1-2 hours.
- Cut losses quickly if actual NFP triggers heavy counter-momentum. Stick to your stop loss.
Directional trades betting on forecast overshoots requires using prudent risk management in case of reversals. Define exits.
Trading Price Chart Patterns Around Releases
Beyond fundamental strategies, technical patterns may signal opportune entries:
- Wedges: Tightening wedge patterns that break out rapidly at 8:30 AM.
- Flags/Pennants: Continuation patterns that resume momentum after volatile consolidation.
- **Cup & Handle: **Cup patterns that trigger breakouts exceeding prior high.
- Double Tops / Bottoms: Reversals confirmed by NFP reactions at key technical levels.
Incorporate chart patterns with fundamental signals for high probability setups.
Managing Risk and Psychology Trading NFP
Despite strategic approach, maintain discipline:
- Curb position size – never risk more than 1-2% of capital per trade.
- Allow profits to run but set clear exit rules and targets.
- Accept stop loss hits – don’t chase price or deviate from plans.
- If unsure, sit out releases until conviction develops through practice.
The speed of moves rewards discipline. Trading psychology must align with risk management principles.
Now that we’ve surveyed various trading strategies, let’s assess past examples.
Case Studies and Lessons from Previous NFP Releases
Analyzing historical NFP announcements provides helpful behavioral context and lessons on trading them. Consider these examples:
| January 2024 | 175,000 | 353,000 | Modest upside surprise strengthened USD briefly before gains faded on recession worries. Low volatility print. |
| December 2023 | 180,000 | 353,000 | Major headline beat boosted dollar sharply with USDJPY and other pairs rising. Aligning directional bias with forecast delivered gains. |
| November 2023 | -190,000 | -150,000 | Massive downsides miss from early Covid lockdowns sparked aggressive USD selling across the board. Bullish bias created major losses requiring disciplined risk management. |
| January 2019 | 165,000 | 304,000 | Huge upside surprise relative to estimates strengthened USD broadly. Breakout strategies worked well on the strong print. |
Reviewing past behaviors provides learning experiences on adapting bias, trading volatile surprises, and managing risk. Now let’s conclude with final tips.
Key Takeaways for Trading NFP Successfully
Here are core principles to recap as you look to trade upcoming NFP events profitably:
- Closely follow economist projections pre-release to gauge expectations.
- Interpret actual NFP prints relative to forecasts and historical data intelligently.
- Understand surges in either direction impact currency pairs, sometimes substantially.
- Consider various strategies like breakouts, directional trades, and technical setups.
- Employ rigorous risk management – limit size, use stops, set profit targets.
- Review past trades to continuously improve execution.
While volatile, NFP presents recurring monthly opportunities if approached strategically. Blend fundamentals with technical cues while exercising prudent risk practices.
I hope these insights provide a helpful guide as you formulate plans to trade future NFP releases skillfully. Let me know if you have any other questions as the next event approaches!