
Good morning Traders! Yesterday we saw US equities resuming their 2023 rally in anticipation for today’s inflation data. The expectation is for CPI for the month of January to rise to 0.5%, and the yearly CPI to drop to 6.2%.
However, compering to the last three months, this would bring the smallest rate of decrease, which may keep traders still on edge. Analysts from several investment banks, have been sounding the alarm that the market is ignoring the FED and that the US equity market is ripe for a selloff.
As a technical trader, I look at elements such as overextension, levels of support and resistance and momentum indicators, to gauge the strength of a trend, and the likelihood of a pullback or a change of direction.
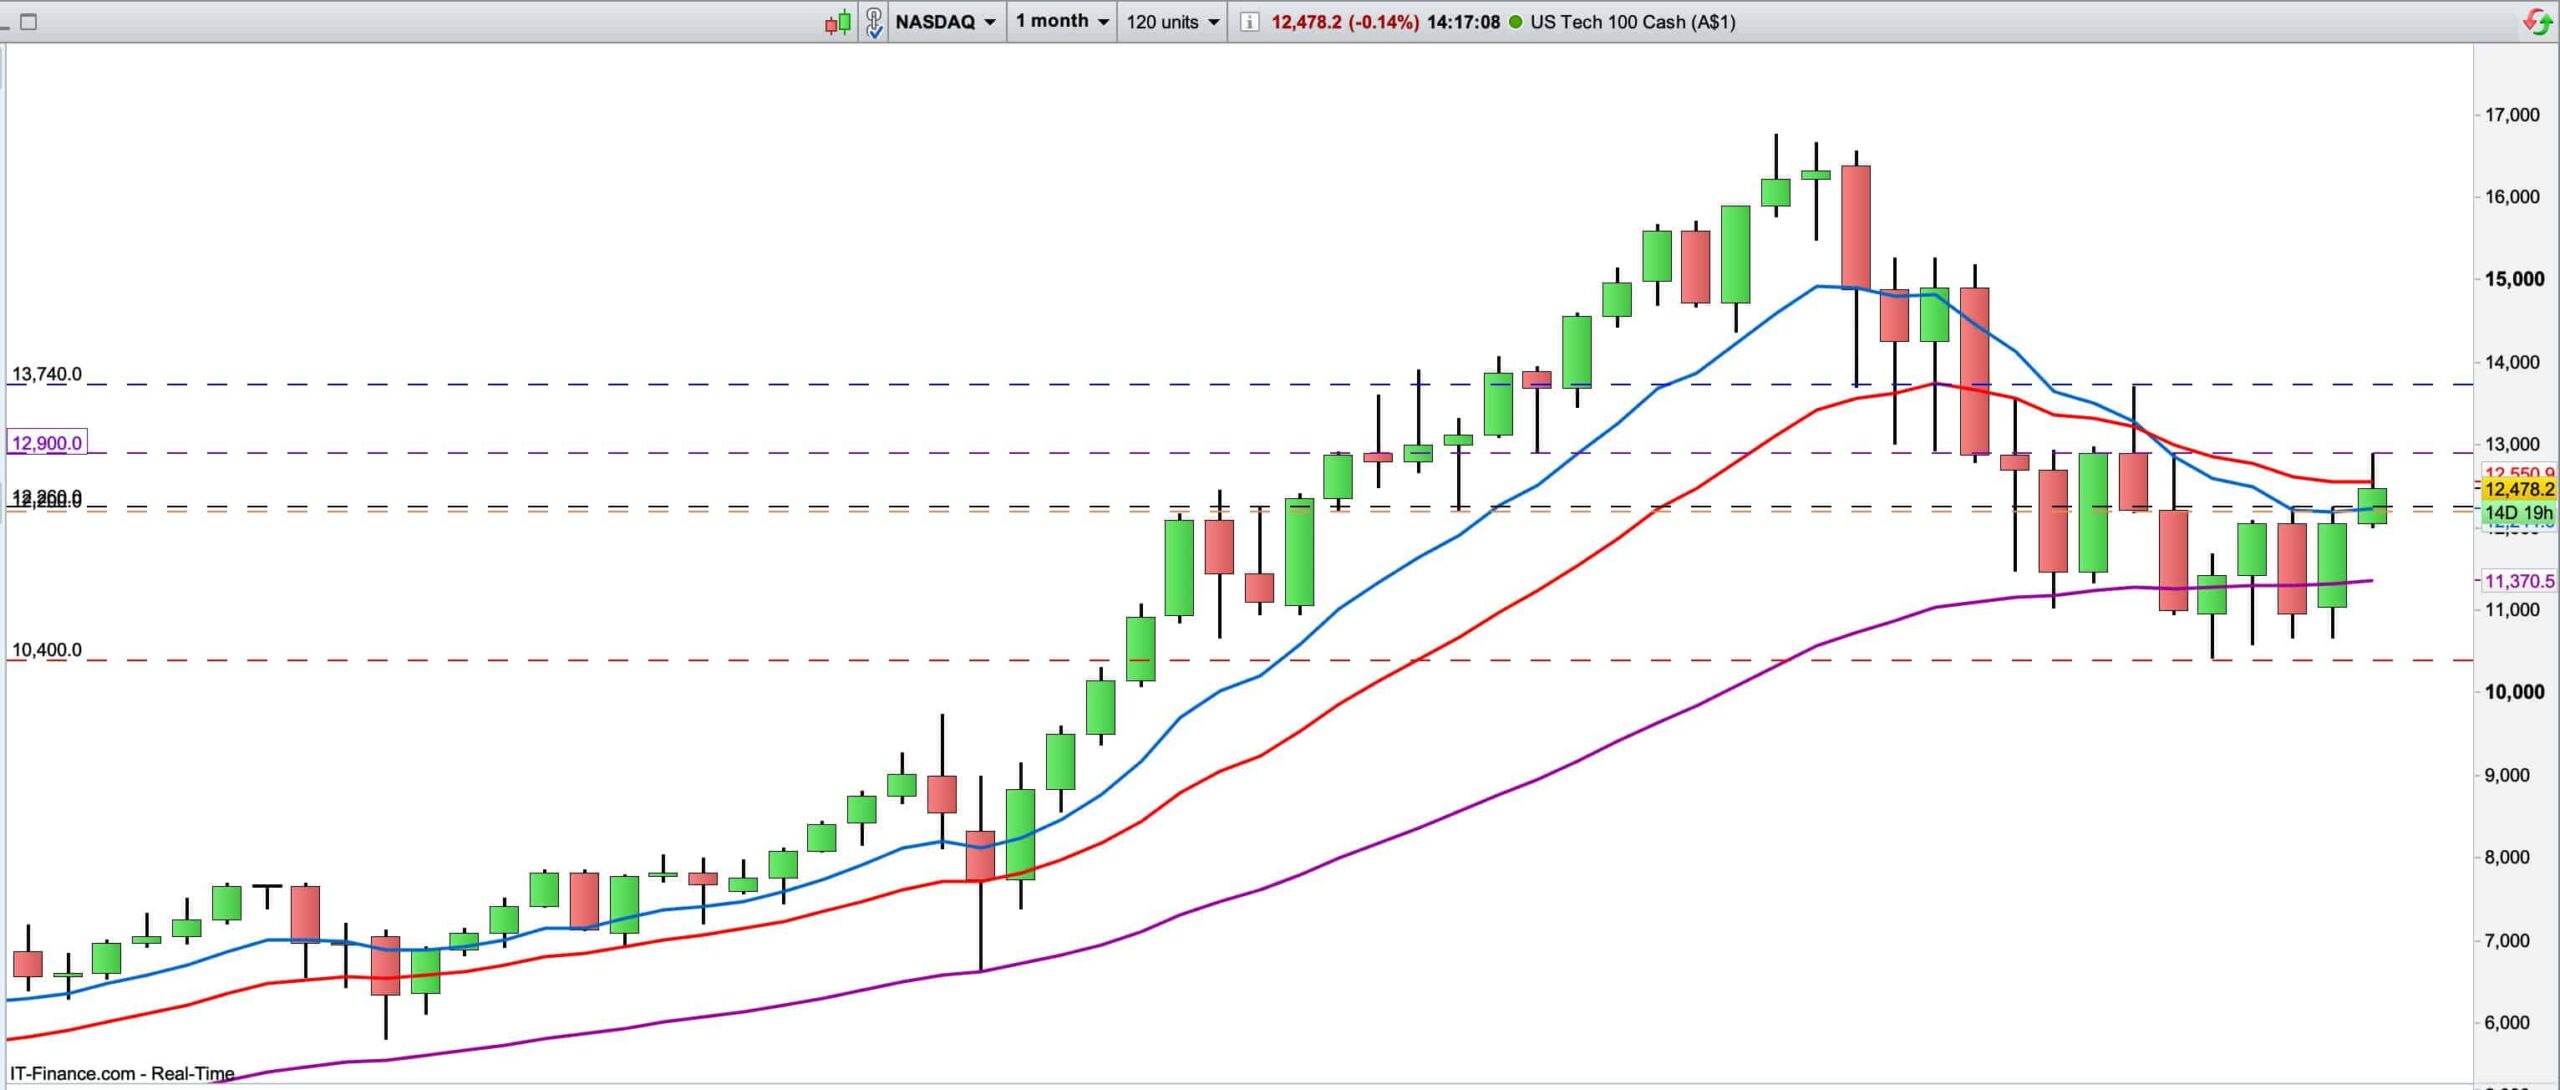
Nasdaq
The Tech heavy index has been very sensitive to rate hikes and rise in inflation. From a technical perspective, the market is still in a downtrend on the Monthly chart and has found resistance, once more, at the strong S/R level of around the 12,900.
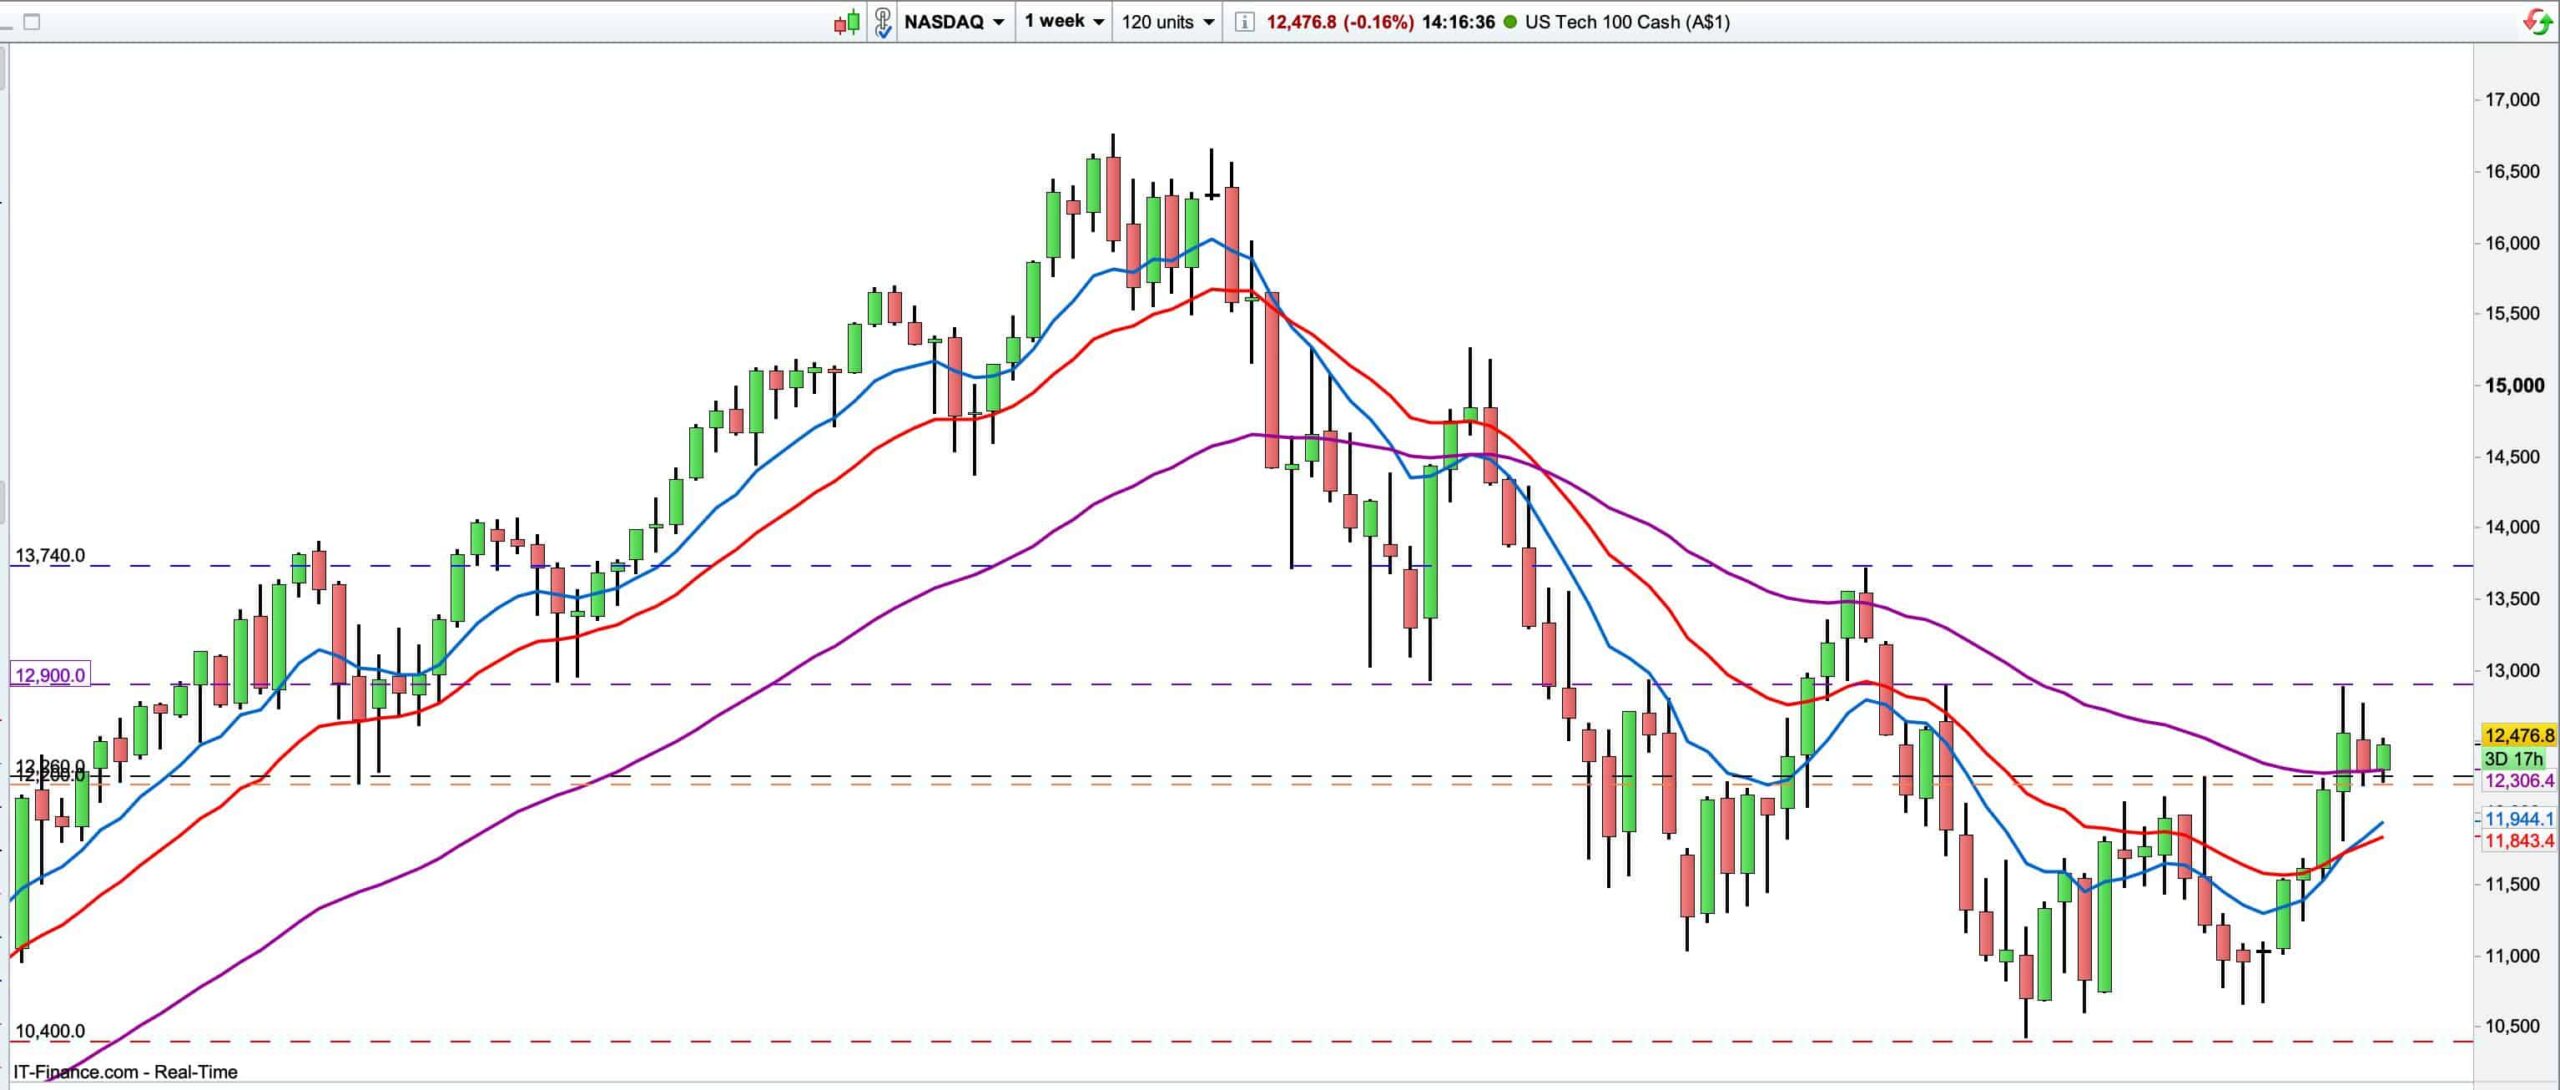
The Weekly chart on the other hand, has already moved into an uptrend, and the momentum indicators are converging to the upside. Here too, we can see the strength of the S/R level at 12,900, it was the Weekly chart swing Higher High.
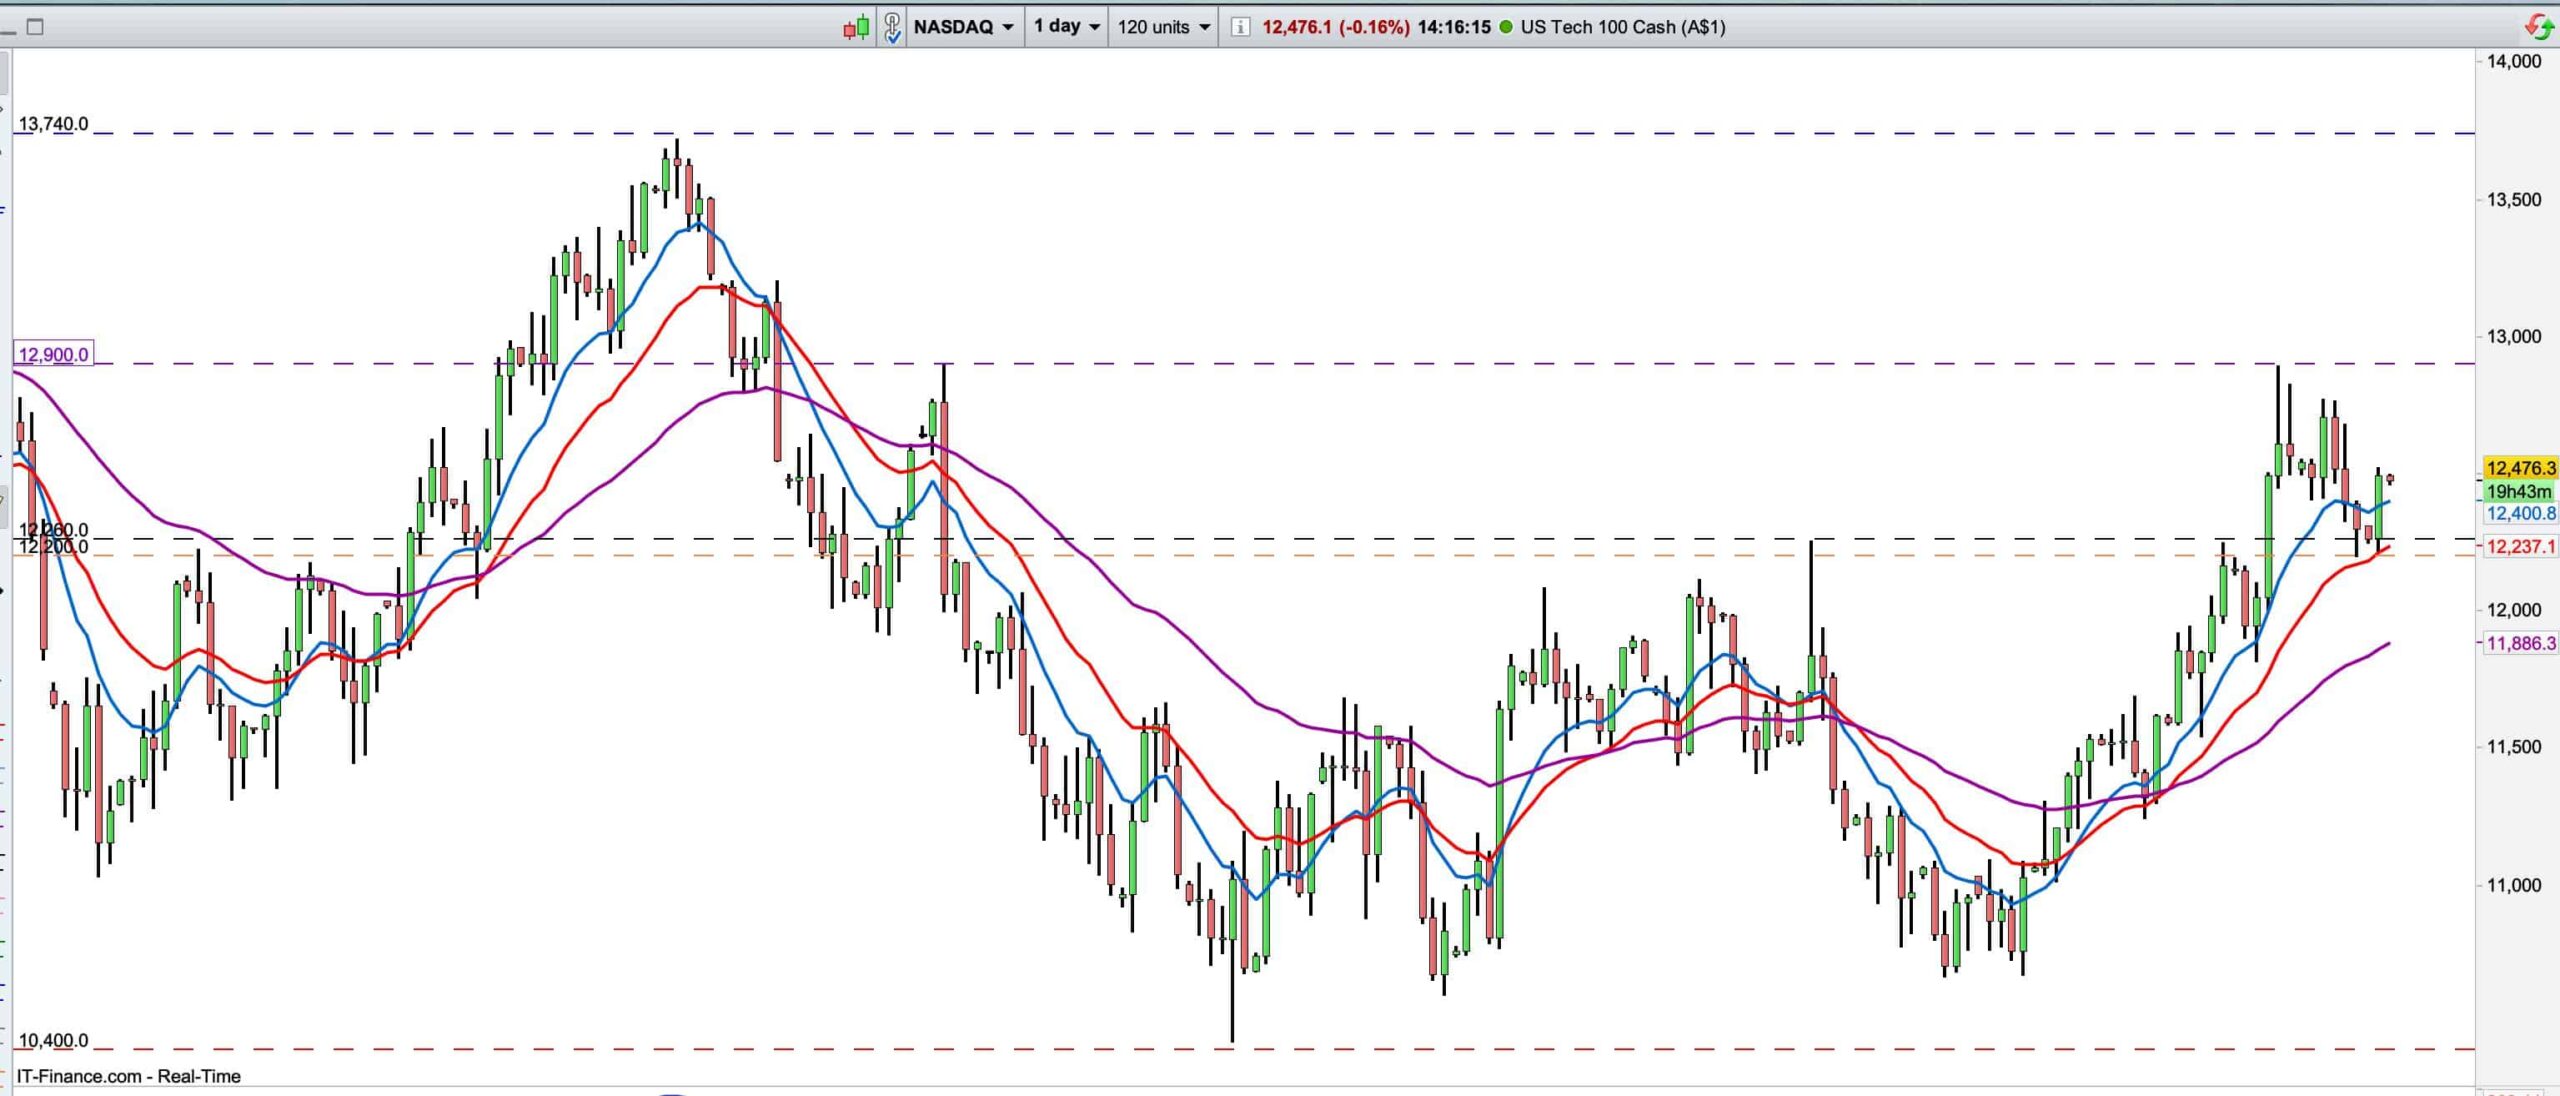
As the Weekly chart was pulling back in reaction to the 12,900, the Daily chart changed direction, however it is still holding above the 12,200 Support area. For a longer term and higher timeframe setups, I’ll be looking at either a decisive break and close below the support level at 12,200 or, a decisive break and close above the resistance level at 12,900 for confirmation of the higher timeframe direction.
Happy Trading!